Overlay Querying
This approach differs from predictive modeling in that we examine existing data in the “results” layer(s) to see what properties of other layers are associated with them. This “hindcast” or “inverse” form of modeling is based on common spatial and attribute data in the “cause” and “effect” layers.
Characterizing based on coincidence
- “What the average slope of a pine forest compared to a corn field?”
- “Are south or north-facing slopes wetter? steeper?”
- “Is the range of preferred aspect greater for skunks or for squirrels?”
For this example in the “inverseQ” demo project, we ask
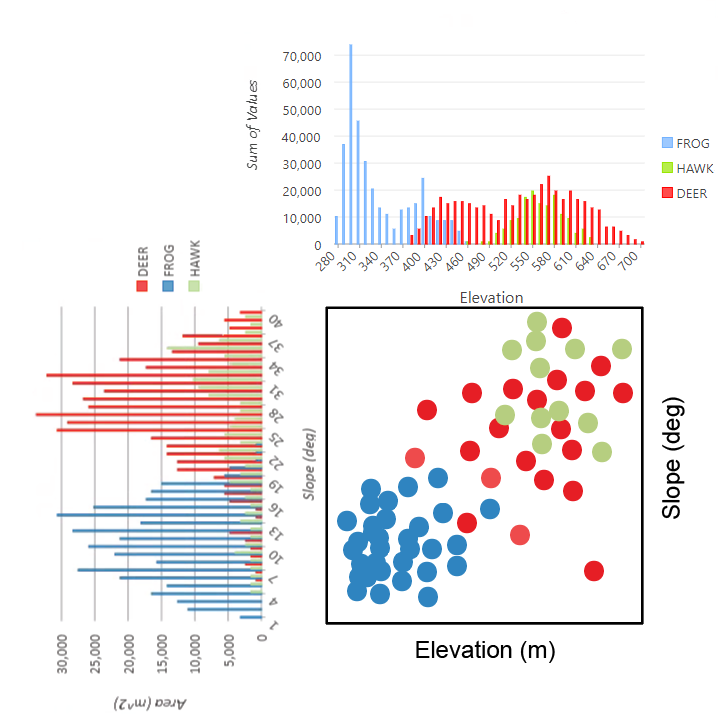
“at what elevation and/or slope are the different species likely to be found?”
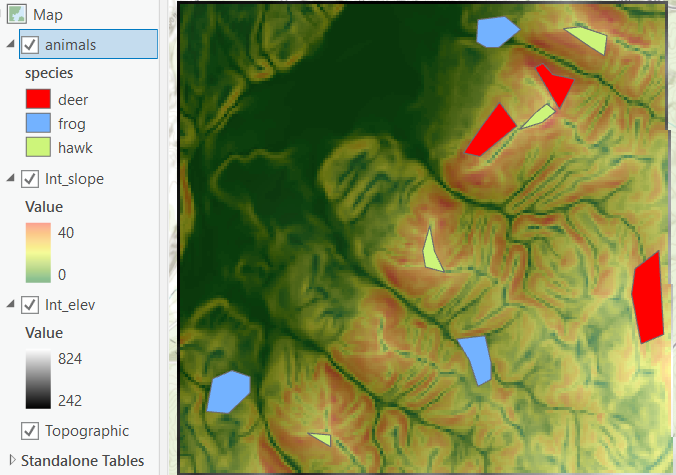
In GIS overlay parlance, a zone is a group of cells or features that all share the same attribute, and a region is a group of cells that are contiguous (or a single feature). Thus a zone can comprise several regions. To examine the characteristics of another layer within all the area of each zone, we use “Zonal” functions, like “Zonal Statistics” to characterize all the cells within the “zone” overlay.
—But first we’ll have to do a little geometry conversion; we’ll try the “zonal statistics” on the animals layer, but that gives the zone statistics for each polygon, not by species. To get a single report for all the “deer” polygons, we turn those into a “multipart polygon” using the Vector Geometry/”Collect Geometries” tool. —
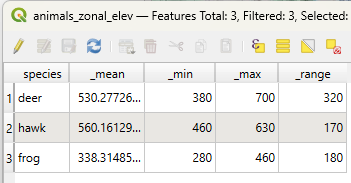
The output of “Zonal Statistics” having chosen mean, range, min and max gives the results in the attribute table.
Cross Tabulating the attributes of intersecting themes (also “coincidence” and “Crossing Tables”) gives the distribution (by count or area) of the cells of one raster within the zones of another.
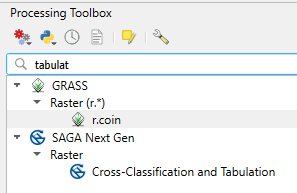
This geoprocessing task allows you to see the range of values for a continuous integer or discrete theme with the range of values for a zone layer (or perhaps, another discrete). First we’d have to create a raster version of our species vector layer. But it doesn’t have a number for the different species, so we’ll have to calculate a new 32-bit integer field using the “field calculator” (look for the abacus button) using the “CASE WHEN THEN” syntax. Search for “case” to insert it (or copy the text below).
CASE
WHEN "species" = 'deer' THEN 1
WHEN "species" = 'frog' THEN 2
ELSE 3
END
When we run the “coincidence report” on animals and elevation using GRASS “r.coin” we get this lovely mess, which we could parse into data, given a beer, a big beer……..
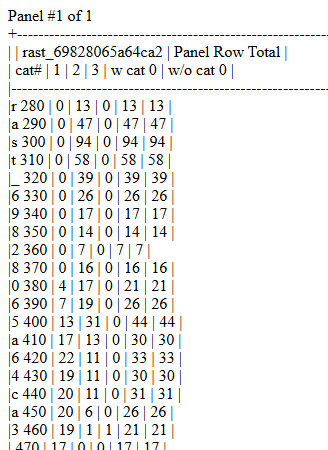
We would need to repeat for slope to get the results shown below.
I made plots from output tables in ArcGIS Pro, which are dropped on two different axes below. Although the deer and hawks overlap, we can separate out the frogs based on slope and elevation. Adding more variables might allow you to separate them more effectively.
I am not skilled enough to do this kind of plotting in QGIS, but hopefully soon.
In ArcGIS
Tools: Zonal Statistics (one output raster with one statistic), Zonal Statistics as Table (all the stats for each zone), Zonal Histogram or Tabulate Area are in Spatial Analyst/Zonal toolbox

