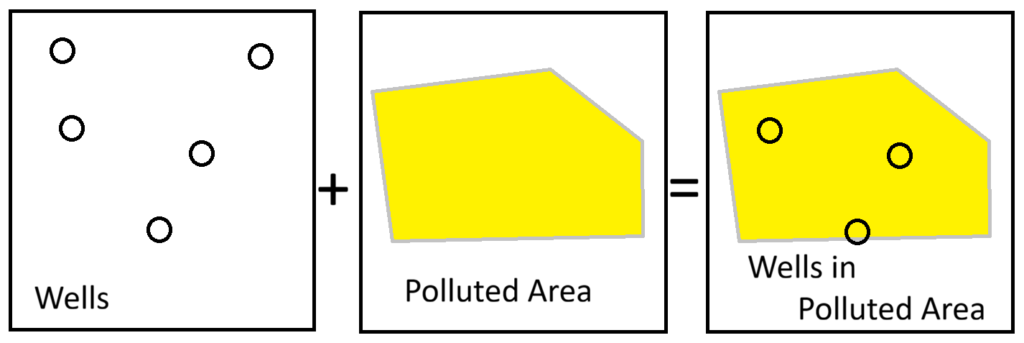
Overlay Analysis is the process of combining data or information from two or multiple data layers to arrive at new information. The process can simple, like determining which wells are within a mapped area of pollution…..
…. or complex, where multiple thematic layers are combined and assessed to produce a results like this hazard map for earthquake induced landslides
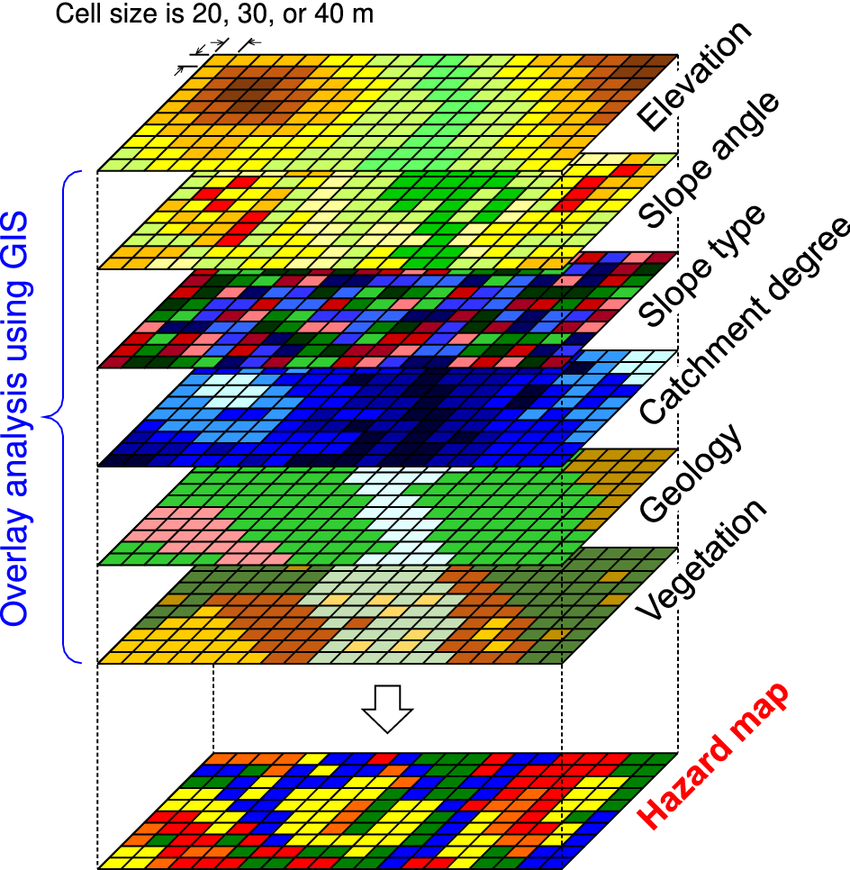
Kohno, et al., 2022, Evaluating earthquake-induced widespread slope failure hazards using an AHP-GIS combination DOI: 10.1007/s11069-022-05725-w
Overlay analysis can be accomplished with any data type (raster, vector, etc) but the type of output results depend on the type of input.
Some of the common types of overlay analysis are
-
- map algebra
- Boolean combinations
– “Hay fields AND a gentle slope”
– “<1000 ft from a stream NOT forested” - simple math on two or more layers (e.g., Crop production in one several years added together, county by county across the country)
- Boolean combinations
- selecting features from, editing or combining layers
- clipping – a cookie cutter
- intersection – keep any whose lines or boundaries overlap
- union – combining two layers into one
- etc
- tabulate areas or cross tabulation
- what is the area of each value in one layer at each value in another (table output)
- What is the number of acres for each land use, separated by state? You could then make histograms, for example.
- What is the distribution of slope values for each of the different types of geology?
- spatial joins of attribute tables
where the attributes of one layer are analyzed (count, mean, range, max, etc) based on whether they occur within/near/outside of units of another data layer.
This spatial join allows the count all burglaries (a point file) within each precinct. Or show the average time of the burglaries (as long as that is one of the attributes).
- map algebra
edited by DJH January 15, 2026