The distribution of points, polylines, and polygons
- Are there clusters of points or polygons? Is the distribution random, ordered, etc?

In QGIS, use the Nearest neighbor tool from the Vector Analysis processing toolbox.—- the reported statistics report Z-score, which tells you whether or not the points are likely to be randomly distributed, dispersed evenly, or clustered. Cluster analysis is an important part of interrogating point features in GIS.

- Or how about patterns?
Is there a spatial orientation to the distribution of points?
from the ESRI online help from an earlier version of Directional Distribution for ArcGIS

- Would that help us with these tick borne infections data?
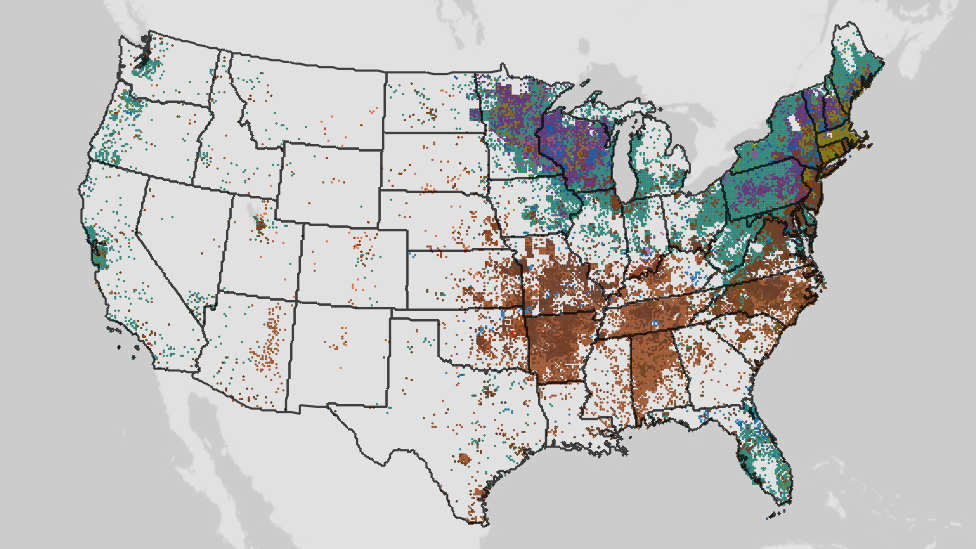
CDC’s map of Tick borne illness https://www.cdc.gov/ticks/data-research/facts-stats/geographic-distribution-of-tickborne-disease-cases.html - Are they clustered?
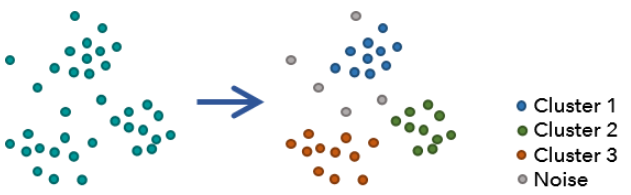
from the Find Point Clusters tool in the GeoAnalytics Toolbox.
Let’s try it in ArcGIS… on fire data….couldn’t find good disease point data.
- Open the “distribution” project in the demo/distribution folder. This map shows a point file determined from satellites of thermal hot spots and fires globally in the last 48 hours (I loaded these data from this web site by using the Add Data button and choosing “Data from path” which I copied from that web page).
- Select Africa by choosing the select tool and clicking within the continent away from the fire spots
- Use “select by location” to select all the fire spots completely within Africa.
- Use the Copy Features tool to save this to a new dataset (the point cluster tool doesn’t work on a “feature service” layer, we have to make a local copy) in the distribution geodatabase.
- Run the Find Point Clusters tool with
- the Self-adjusting (HDBSCAN) option
- and a minimum of 20 points (or something else you want to try)
- click ok if asks you about your firewall and Java….
In QGIS it is similar, I added the ArcGIS Rest service connection 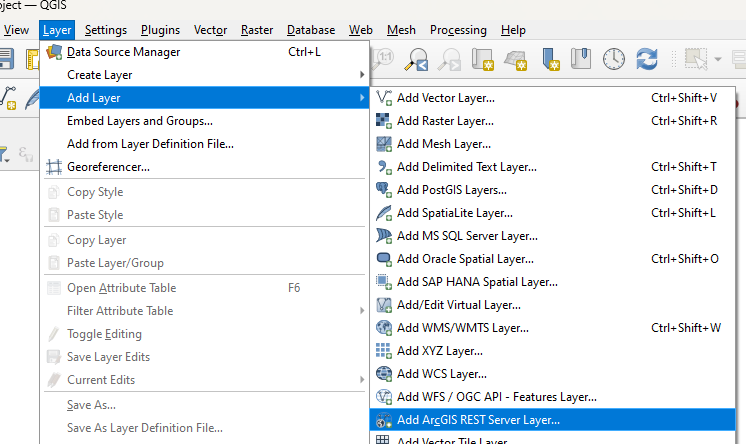
to the map. Select a continent and save them to a temporary or shapefile format and run the Nearest Neighbor tool (as above) and results will be saved to html (they ARE clustered :).