Proximity
During a rain storm, we collect rain data only at isolated points. But what rainfall do we assign to the area between the gauges? In hydrology, one makes “Thiessen” polygons, that associate every point or area on a surface with the nearest gauge. You can search for the Thiessen polygon tool in both ArcGIS and QGIS. In Q, the “frame” is the map distance away from the points. In GIS, this is also known as “proximity to a feature” or “allocation.” For rasters, this is the “allocation” function under the “distance” toolset in spatial analyst (see Euclidean Allocation in the ArcGIS Pro help)).
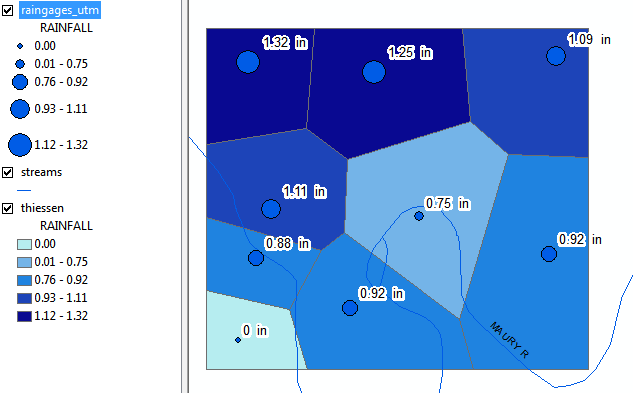
see …demo/proximity/ for both Q and Arc versions
In ArcGIS, let’s try allocation on streams too. Can’t do Thiessen polygons to a vector line feature in QGIS, but if we rasterized the streams (and got rid of the NoData in between them), we could using Whitebox Euclidean Allocation.
Though Experiment
- If you are trying to determine areas that will flood (< 20 ft above the river), how will Proximity help you?
- Can you determine the steps given data for streams (vector) and elevation (raster)?
Other measures of “nearness”
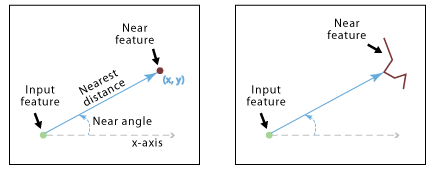
- What is the closest feature (or features, or points) to another feature or point (output by new feature or new table). QGIS has tools to find the closest line or polygon centroid and add it to the Input feature attribute table. ArcGIS does the same but uses the line perpendiculars and polygon perimeters rather the centroid. We could play with they using the rivers and the rain gauges for example. In ArcGIS, Use the Near tool from the Proximity toolset. For distance ArcGIS calculates distance differently.
- What polygons are touching the sides (and nodes) of source polygons?
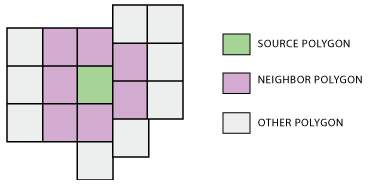
Here’s theArcGIS Polygon Neighbors Tool that “creates a table with statistics based on polygon contiguity (overlaps, coincident edges, or nodes).” ArcGIS Pro help - In Q, no tool completes this directly. But Q allows you to determine neighboring polygons, or calculate features of their borders, in one of two ways:
- The QNeighborhood plugin – this allows you to directly interact with the map using your cursor. Every polygon you select will have its neighbors highlighted.
- Using field calculator and leveraging the aggregate method to summarize features of a vector layer in relation to the other features in a given layer. One can determine each state’s neighbors, report them as a string, and then calculate the border length of each state. See this Spatial Thoughts blog by Ujaval Gandhi for more details…