The three types of GIS Data are
-spatial,
–attribute, &
—metadata
- spatial data
- vector data
- Point Data — layers containing by points (or “events”) described by x,y (lat,long; easting, northing)
- Line/Polyline Data — layers that are described by x,y points (nodes, events) and lines (arcs) between points (line segments and polylines)
- Polygon Data — layers of closed line segments enclosing areas that are described by attributes

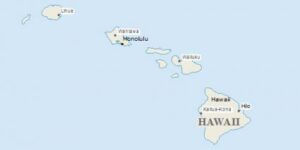
Polygon data can be “multipart” like the islands of the state of Hawaii (see below).
- vector data
-
- raster or grid data (matrices of numbers describing e.g., elevation, population, herbicide use, etc.
- images or pictures such as remote sensing data or scans of maps or other photos. This is special “grid” where the number in each cell describes what color to paint or the spectral character of the image in that cell. (to be used, the “picture” must be placed on a coordinate system, or “rectified” or “georeferenced”)
- TINs – Triangular Irregular Networks – used to discretize continuous data
- Terrain or Mesh datasets built from lidar and other point clouds.
Demo in QGIS
1. Navigate in P:\ to your copy of the folder …..\demo\introQ\”
2. Open QGIS project called “intro_Q-SpatialData”
3. Examine the three types of spatial data
- attribute data are non-spatial characteristics that are connected by tables to points, lines, “events” on lines, and polygons (and in some cases GRID cells)
- A point, vector or raster geologic map might describe a “rock unit” on a map with a single number, letter or name, but the associated attribute table might have
- age
- lithology
- percent quartz
- etc, for each rock type on the map.
- most GIS programs can either plot the polygon by the identifier or by one of the attributes

 The above examples from the following project shows two ways to portray census data in Virginia. In the top image, each county/city gets a name and unique color , and in the bottom, the population density per square mile is read from the layer’s attribute table and plotted using a different color for each class of density.
Try it yourself in QGIS- open the “intro_Q_attributes” Q project from the demo\intro folder
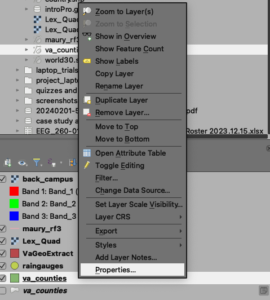
- right click on the name of the layer in the table of contents “Va_counties” and choose “Open attribute table” to see the range of data types associated with these “geometries.”
- highlight the “VA_counties” layer in the TOC, then change the way the data are plotted using the layer styling panel

- or right-click on the “VA_counties” layer, and change the way the data are plotted using the symbology tool on the “Properties” tab.
- A point, vector or raster geologic map might describe a “rock unit” on a map with a single number, letter or name, but the associated attribute table might have
- Metadata
- metadata are the most forgotten data type
- absolutely necessary if you’re going to use data, or if someone is going to use your data later (or your derivative information)
- contains information about
- scale
- accuracy
- projection/datum
- data source
- manipulations
- how to acquire data
- many different “standards” for collection and presentation of metadata, such as FGDC used by US gov’t agencies.
You will be keeping metadata in QGIS using the metadata editing ability in the properties box (more later on this important breadcrumb leaving task). Metadata are enabled via XML files that should travel with the data.
Edited by NDB January 13, 2025 & DJH Jan 9, 2026,