Density Surfaces
Many types of event or count data are collected at points
- population in census tracts
- earthquakes
- bird counts
- rainfall and snowfall
- pest traps (gypsy moths, for example)
- air quality (e.g., PM10)
- well samples (for water quantity or quality)
- houses with asbestos
- hazardous waste sites
- volcanoes
It is often desirable to know how many occurrences per area, like this example of landslides triggered by a major earthquake in New Zealand. A Density analysis counts the number of points within a search area, and is one of two ways that you can go from points to a surfaces. The others are to interpolate a surface from the values of the points themselves (coming soon to a classroom near you), or use Thiessen polygons or allocation. Which of the above are appropriate for analyzing “density” and which would you use another?
For the QGIS density analysis, you have the option of choosing the search radius, and whether the summation used in “count” is just the number of points or the value of some field in the attribute table associated with the point. Open the Q_density project. You can extract density as its own raster layer, or compute it symbolically.
- Option 1: Run the Heatmap (Kernel Density Estimation) tool. A Kernel is a mathematically-derived search window that moves over the surface of the layer. You can tweak the selection parameters of this heatmap tool – how big of an area it searches when estimating density, the output raster cell size, whether to weight or measure distance with respect to some other attribute (earthquake magnitude, focal depth), and even the mathematical function used to define the kernel (Quartic or circular by default).
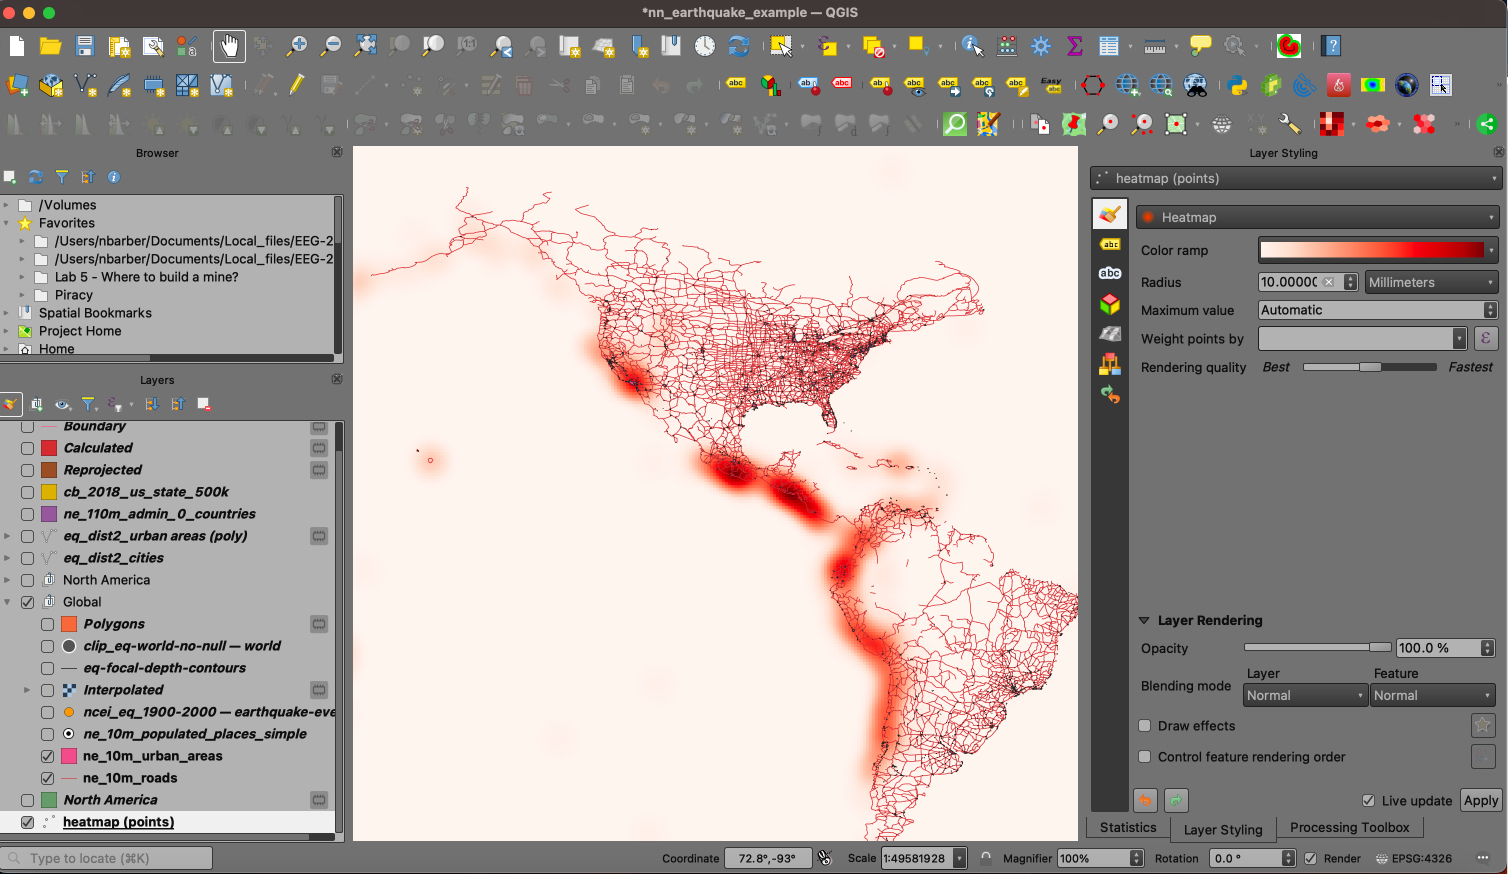
Screenshot - Option 2: Under Layers styling for points, you can change the rendering style of a point layer using the Heatmap style option. This option presents you with the least control over the output, and the layer is not actually a raster, but for visualization purposes it can be useful. However, no control is given for the input or the output!
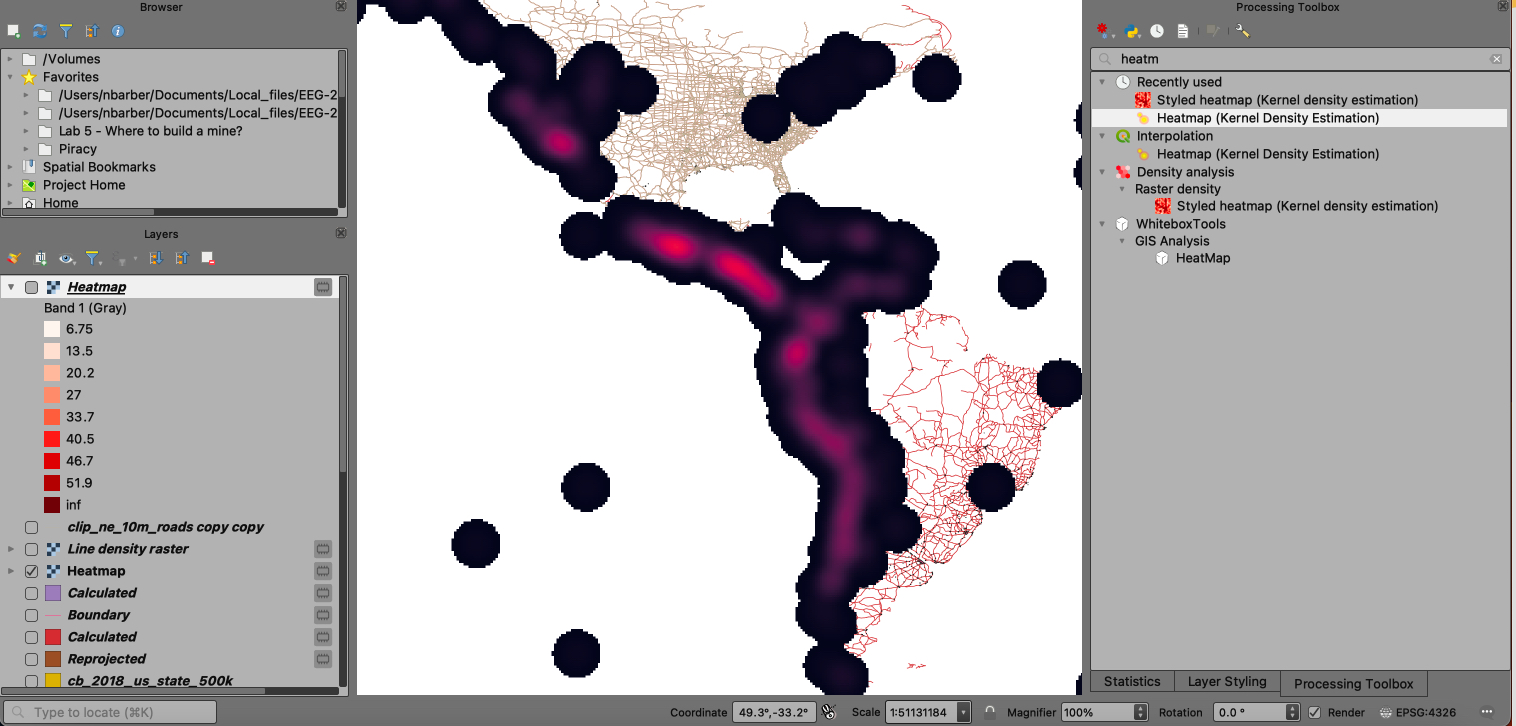
Screenshot - Option 3: Density Analysis Plugin. I (Nick Barbor:) did not test this newer tool extensively, but you can see how its more sensitive KDE controls allow you to make more stylized products easily. This plugin also lets you apply density estimates to polygons. Learn more watching Youtube video.
Screenshot
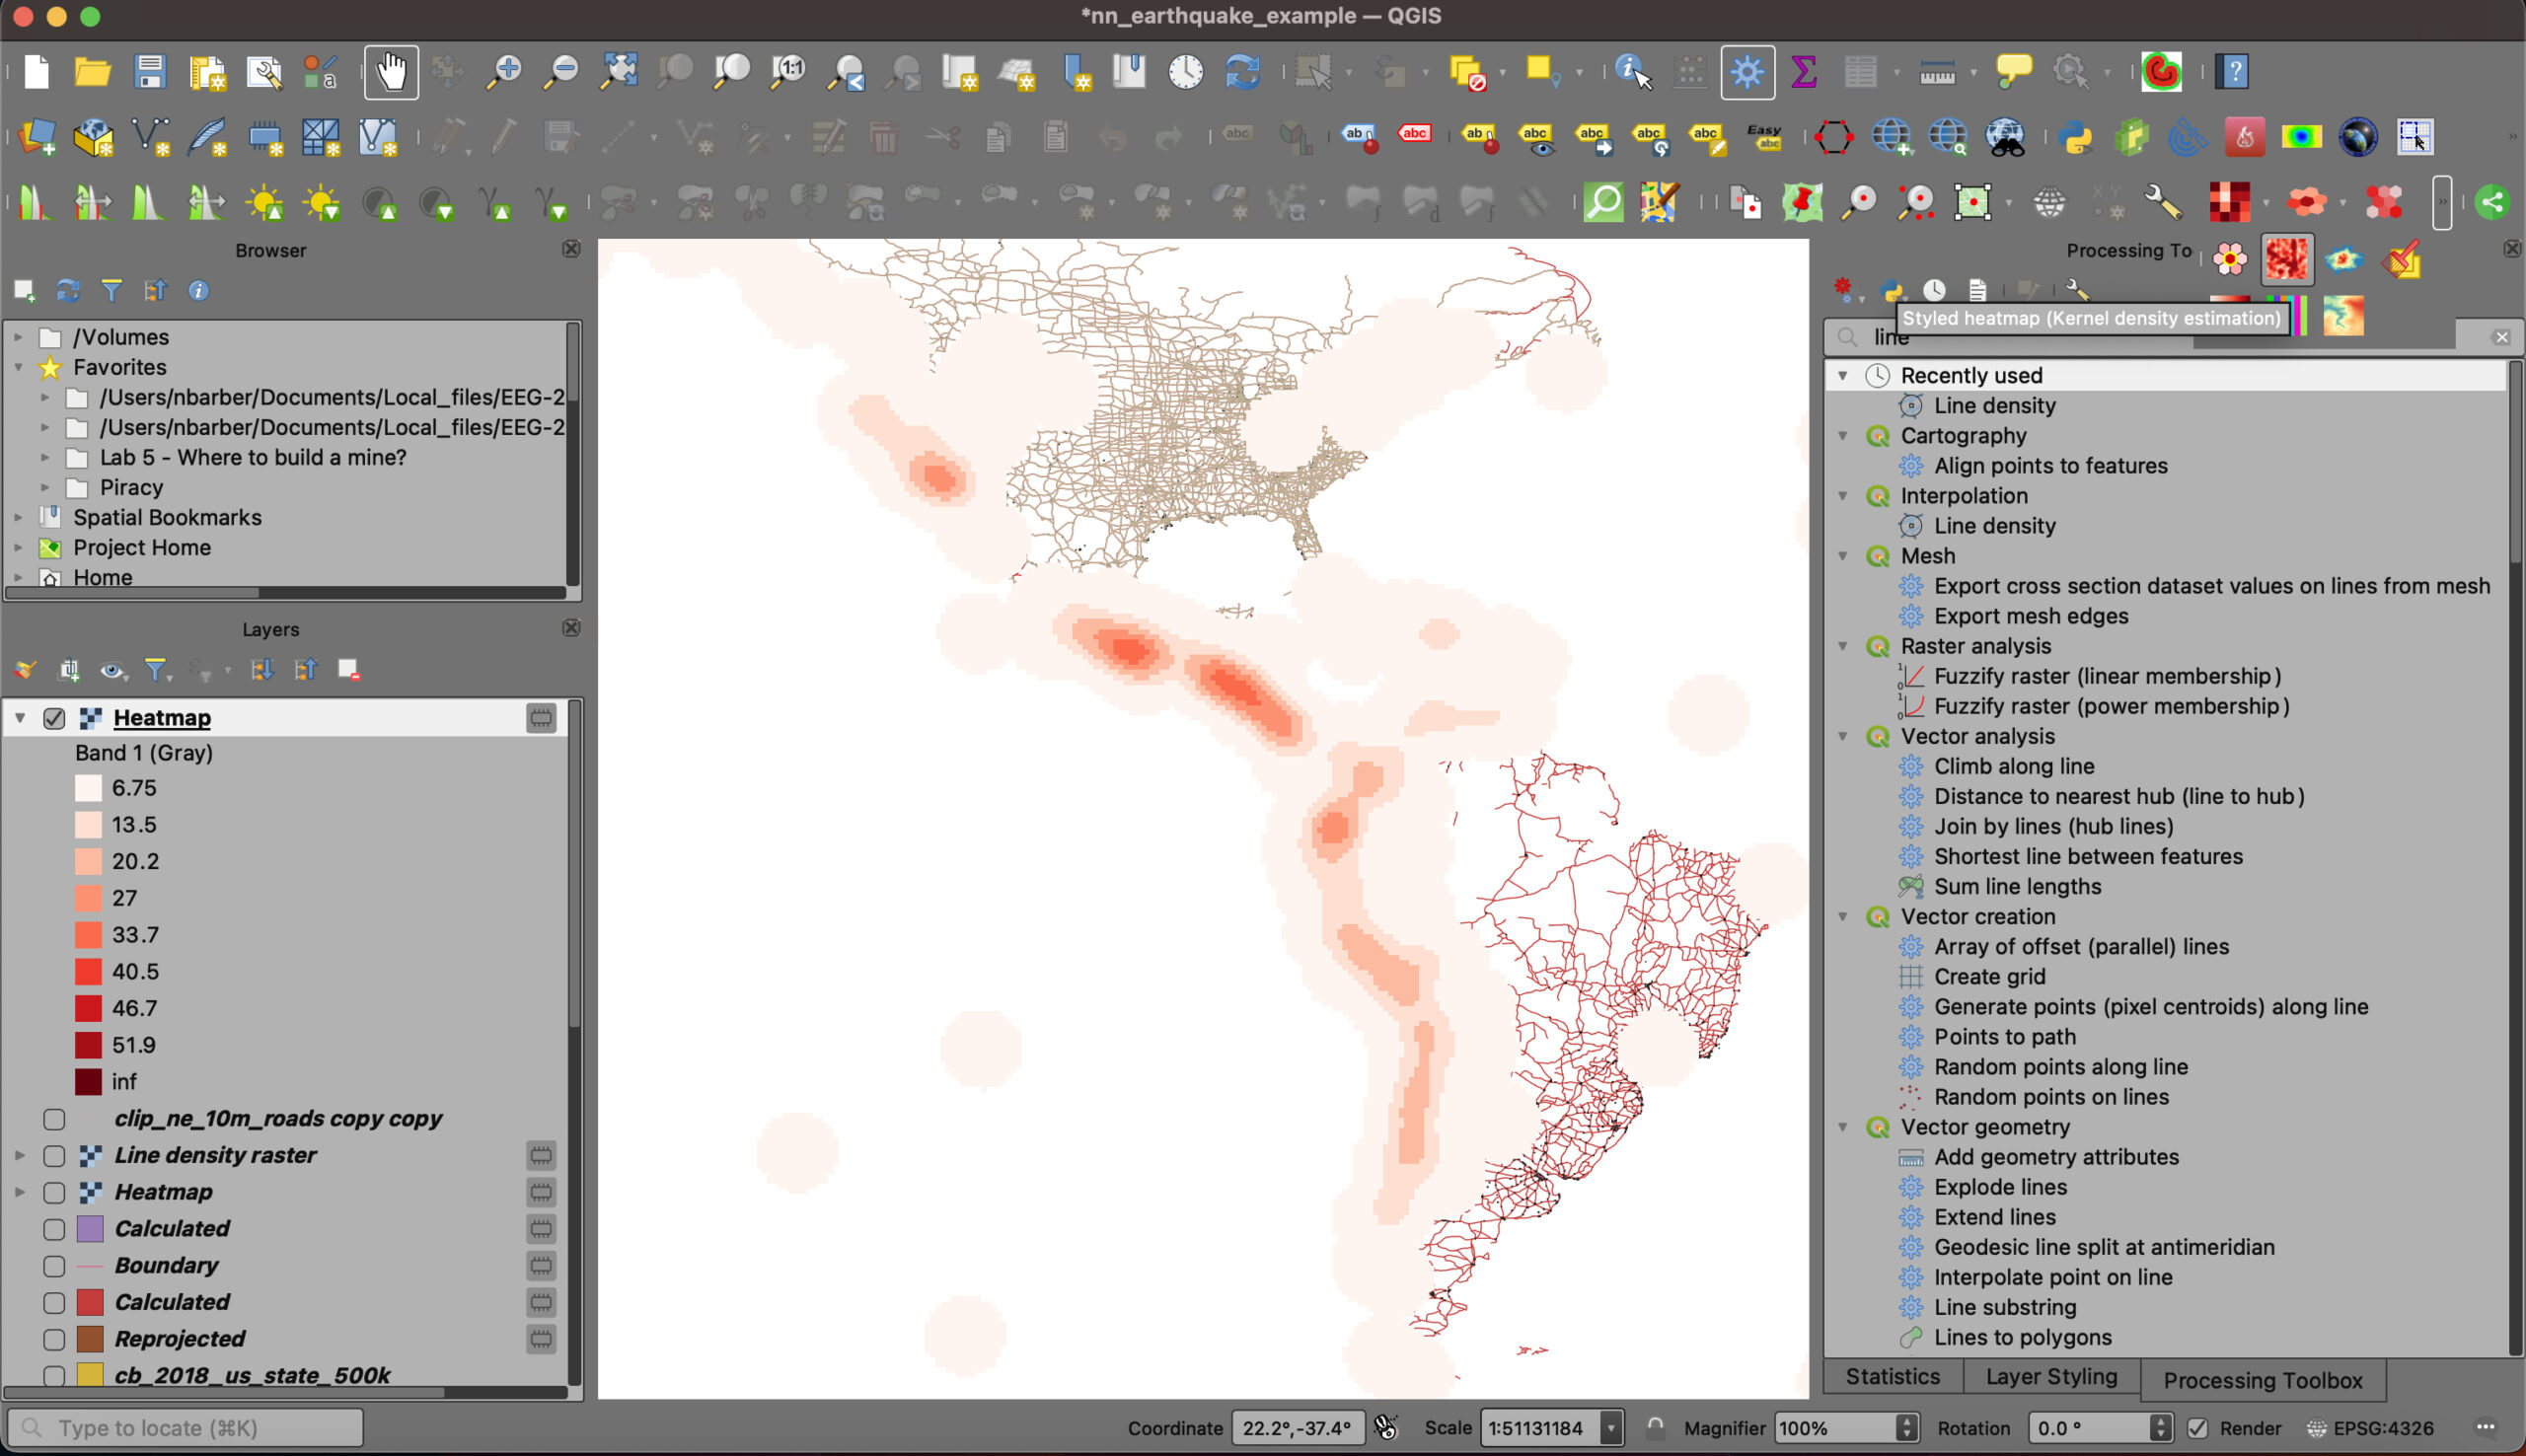
Both of these options take advantage of point layers. For line layers, you might use the Line Density tool in the processing toolbox. Below, you can see the density of the road network in North America, left as a singleband gray symbology type.
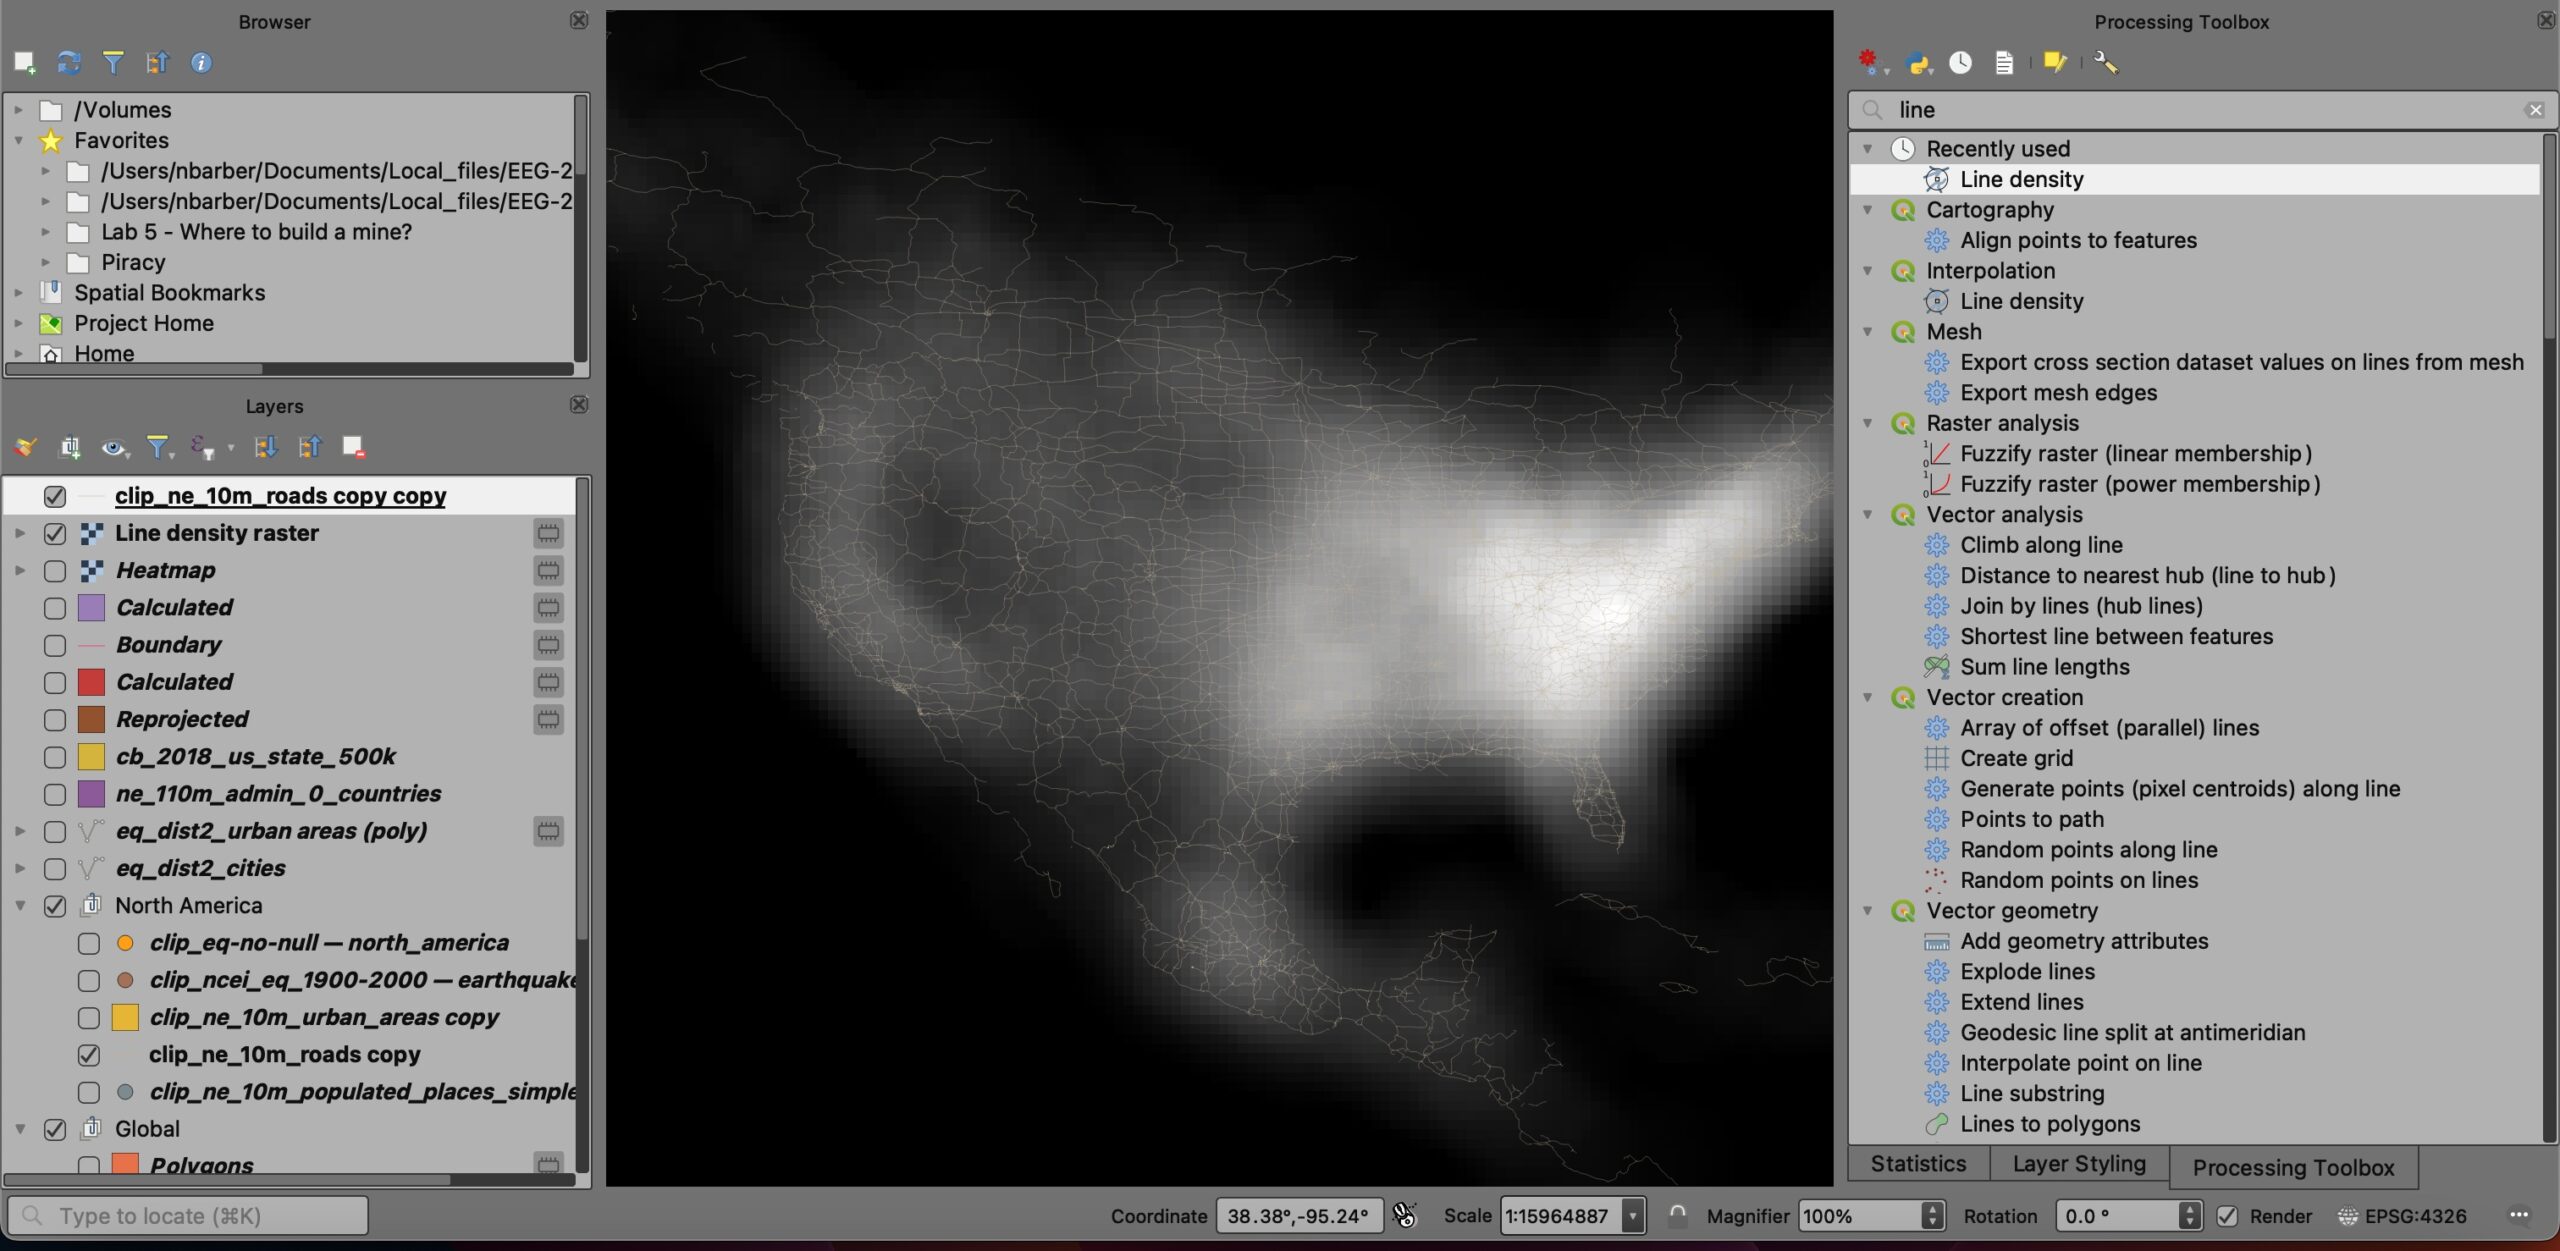
Make sure you control the output coordinate system! Notice the impact of the search radius on the output. You can see the effect easily. What happens if you make the search radius bigger, or smaller? Without changing from WGS84, your units for searching will be in degrees!
For the ArcGIS density analysis, you have the option of choosing the search radius, and whether the summation used in “count” is just the number of points or the value of some field in the attribute table associated with the point. Open the demo\density\density project. First, try it by analyzing population data for Rockbridge County, where each point has a value associated with it. Then we’ll look at the this week’s earthquakes in the US.
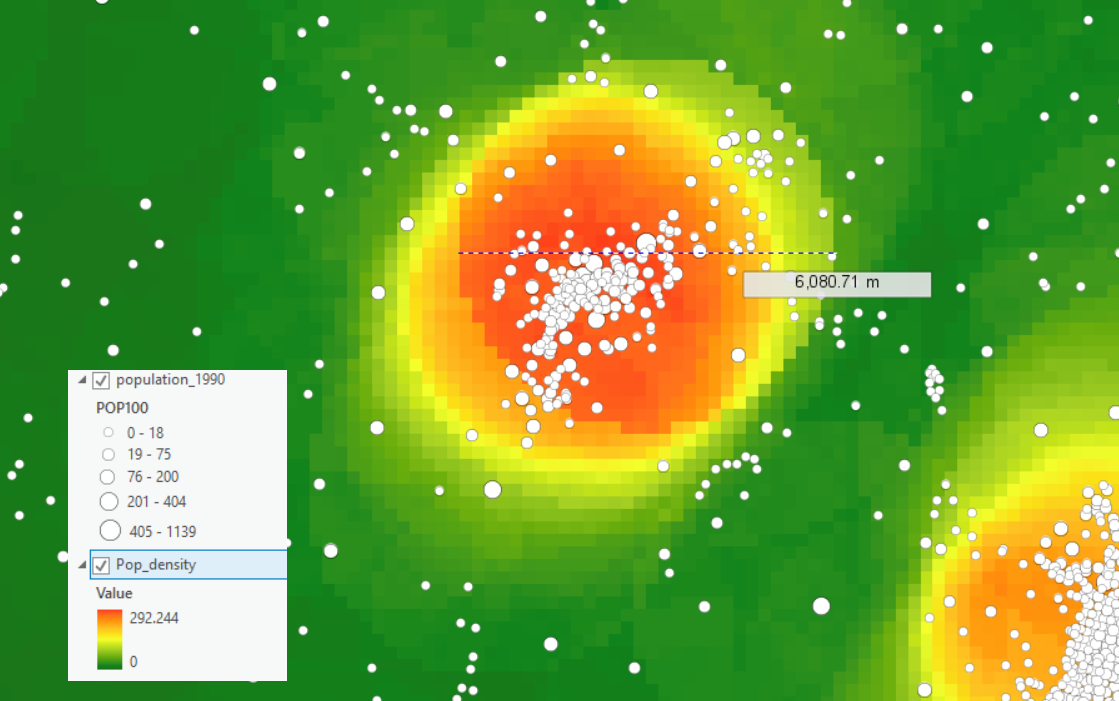
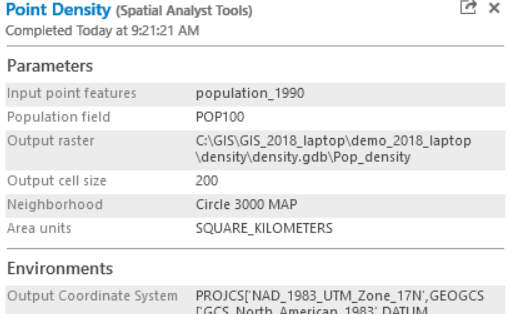
In this example, I’ve tallied the number of residents from the Census point file called “Population_1990” that contains a value for each point, instead of simply counting the number of points. The output is persons per square mile as a grid, with the following inputs to the “Point Density” tool.
Make sure you control the output coordinate system! Notice the impact of the search radius on the output. You can see the effect easily. What happens if you make the search radius bigger, or smaller?
Try the streams in a “Line Density” analysis as well. Make sure your search radius is much larger than the average spacing between streams (well…. try it both ways, smaller AND larger; which is of more use?)
We can collect some earthquakes from the USGS in real time and see where they are most dense. Or we can use the earthquakes I collected some years back. What radius do you use? Note what units and projection the earthquake map uses.

Kernels
The density analysis above uses a uniform search area to count or average the point/line density. But the search area can also have weights, or a kernel, that is applied throughout the search area. The Kernel Density tool does that. It emphasizes the close points and gradually the influence of further points is diminished in a bell-shaped curve. Try that with the same radius circle as the Point Density tool.
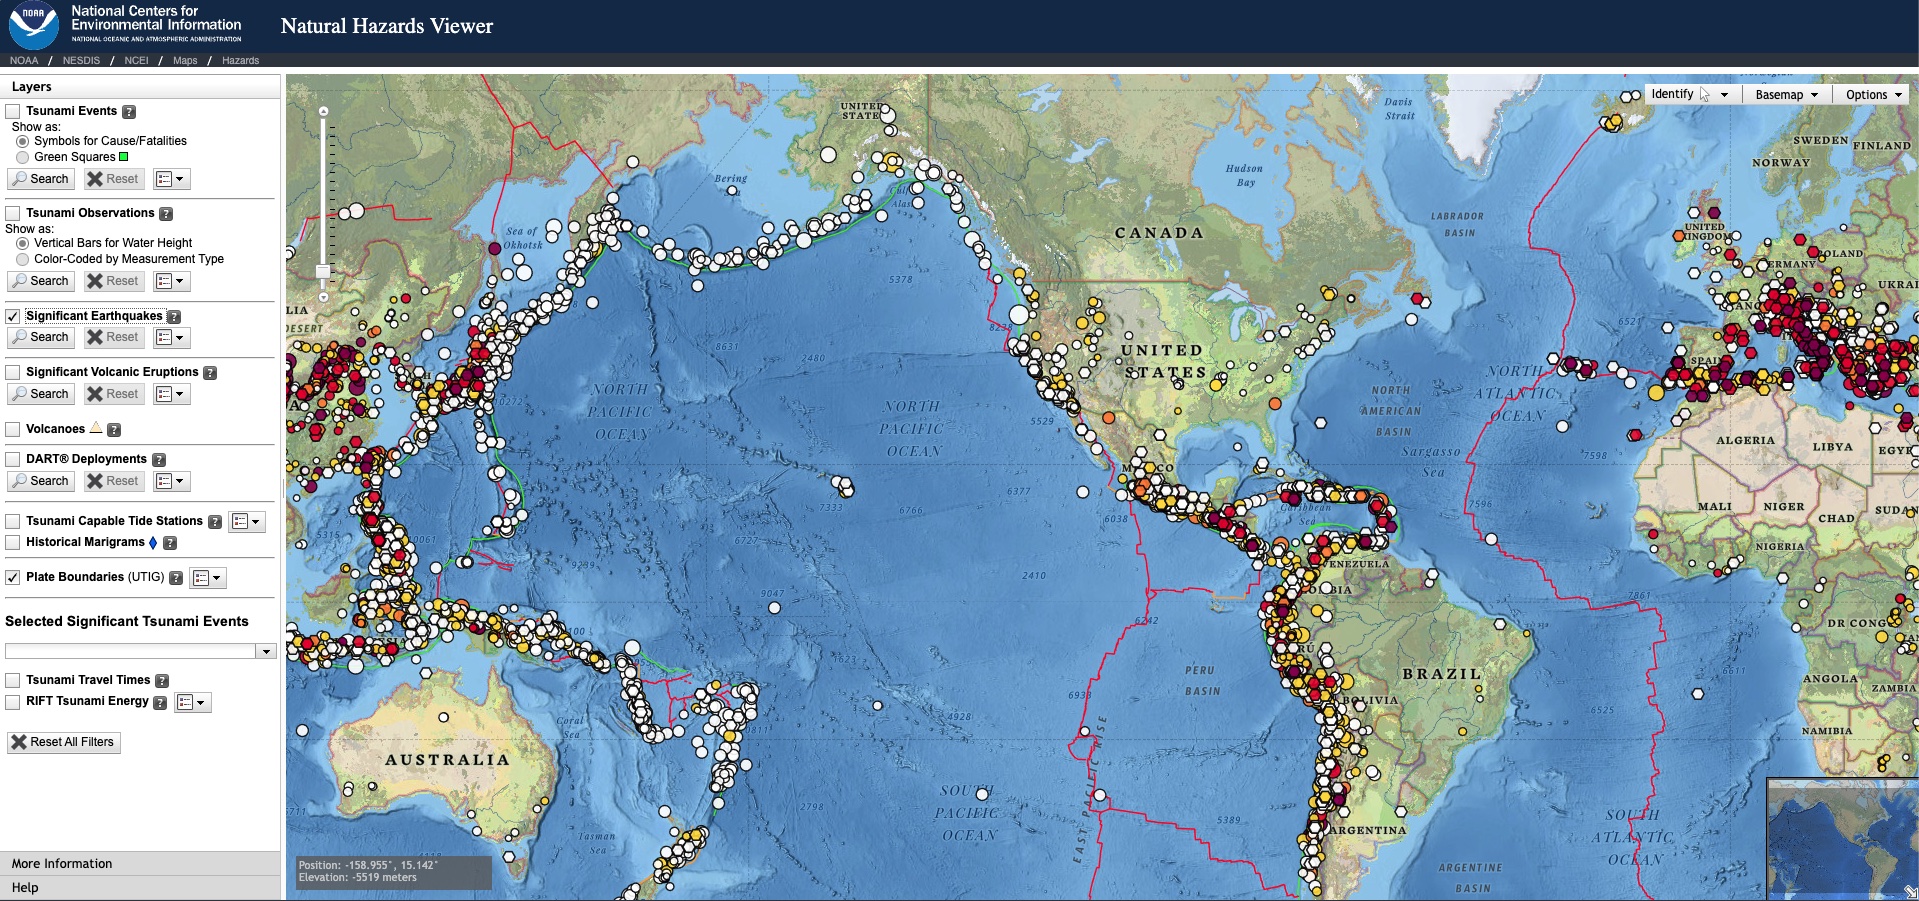
If you want to download earthquake data, you can go to the National Center for Environmental Information (NCEI), hosted by NOAA.