Project 1
Environmental Justice: mapping the distribution of toxic releases in poor and minority neighborhoods
Your goal in finishing the task below is to use the skills that you have developed completing the exercises and in class, as well as to add some curiosity about what you could, or might be able to do.….and then do it. You may (and are encouraged to) work with one other person (who you may not work with on another project until the final project), but be mindful that you need to keep developing your own skills and should be able to complete all the processes by yourself by the end of the project. But DO learn from each other. Please do you own work as an individual or pair; don’t share your process with other groups or use another group’s work in some way.
- The Data
- you will find and ingest data for 2023 and for Virginia only (2023 is the latest year for which good tract-level Census data are available)
- Census (at the tract level)
- Tract geometry as “Tiger/line” shapefiles
- Tables of population by poverty/race/ethnicity for Virginia Census tracts
- EPA Toxic Release Inventory
- tables of releases by chemical and company for all of Virginia, also for 2023
- The study area is defined for you and available in R:\courses
- The Tasks
- set up your workspace
- in the end, you’ll have one folder with everything for your project, including QGIS files, data and documentation. It should also include a breadcrumbs file.
- if you’re working alone, it can be on your laptop or on P:\
- if you’re working with another person, make a folder with your login id and yr in Q:\students\ and work there (e.g., harbord_81)
- You can use your “…\GIS\downloads” folder to receive zip files that you’ll turn into ingestible GIS data. They will get unzipped to your project folder (or copied there once unzipped) and that folder can be cleared when you’re done with the project, saving resources.
- in the end, you’ll have one folder with everything for your project, including QGIS files, data and documentation. It should also include a breadcrumbs file.
- open a word document to record the breadcrumbs of your GIS process and from which you will build your metadata
- upload and ingest the data into a single, well-organized QGIS project that can have subgroups of data (read here about how to group layers in a project) and one final print layout.
- You have two choices for how to digest and present the relationship of poor and/or BIPOC populations to toxic releases for a portion of the Virginia tidewater region
- simply – just display both types of data together in one map, by visualizing them in a way that your viewer can see the relationship you want them to see.
- conduct one or more geospatial analyses of the distribution of total releases in relation to the distribution of poor and/or BIPOC populations and put the results on a map. This will entail going beyond what you’ve learned to do in class.
- produce a layout that shows the results of your analysis or visualization, which includes the other map elements that will allow a viewer to understand it.
- create simple metadata in your data files and in the project that creates the map presentation of those data.
- From your breadcrumbs document, create a brief explanation of your GIS process as a word document
- upload your material to a Canvas discussion and assignment
- set up your workspace
Getting the data
- You may search the web other of sources of these data that I’m not covering here; but you have to make sure you know what you’re getting and you need to save the steps that got you there (the google search, the map server, which layers you got, etc) so I and others could potentially follow your steps.
- Downloading Census table data (csv tables that contain poverty/race/ethnicity information from the American Community Survey)
- start here https://data.census.gov/
- In the search bar type “Virginia Poverty S1701” and go.

- These search terms will become filters for the huge number of data tables (select the table tab) available at the census. The values shown at the right in your window, however, are for all of Virginia, not each census tract. We need a table that divides the poverty numbers into finer divisions.
- To add this 4th filter, under “Geography” in the left panel (expand if collapsed), choose Census Tract, then Virginia, then All Census Tracts within Virginia and the restriction should appear in addition to the other three in your filters.
- Expand the available S1701 tables.

You want the latest 5-year estimate, because that is valid for all areas, not just larger population areas. (the result window on the right should say the table is too big to display) More information on the estimates here. - Find the download button and get it into your downloads folder. When you unzip it, you’ll have three files
- the data table (.csv)
- a list of the columns (with the word “metadata” in the filename)
- and a text file with more metadata
- In the search bar type “Virginia Poverty S1701” and go.
- Ingesting the Census data
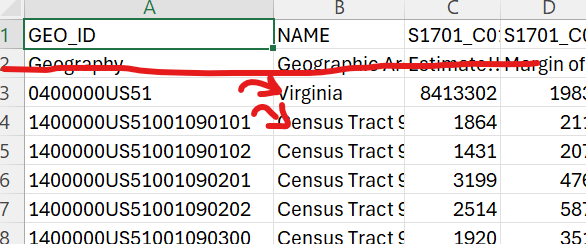
- Read the column metadata, which highlights which columns you need to determine poverty or BIPOC vs white population. How you define it is important, and should also be part of your metadata.
- Make your csv table readable by QGIS as follows,
- only one header row (not the two or three that the census table gives you. I don’t think you need the “all virginia” row, but you can use the table without it
- field names (the top row when ingested) should not start with numbers.
- all rows in a single column (except the top header row) should be of the same type (text or numbers). Mixed columns will be assigned text, for which you cannot calculate values (like total or average).
- Once loaded into QGIS, you can easily hide all the columns of a table, turning on only those you need using the “organize columns” button toward the right on the menu in the attribute table window (I recommend this for the census data. More info: QGIS_docs)
- For this or other data, do any needed calculations in QGIS (not excel, except getting the header rows correct on the fields). Again, leave breadcrumbs in your Word doc.
- only one header row (not the two or three that the census table gives you. I don’t think you need the “all virginia” row, but you can use the table without it
- Download the Census Tracts polygons
- Search the web for “census tiger/line shapefiles” to download. Look for a 2023 version.
- download as a zip file into your “downloads” folder, use 7zip to unzip them in that folder, and ingest them into your project.
- This file has the geometry that corresponds to your poverty/ethnicity table data.
- Download the EPA’s Toxic Release Database
- Go here (TRI Toxics Tracker)
- Select “Virginia” under the Geography and “search”
- Click “Filters” on the upper right side of the page, and under “Reporting Years” select 2023 only
- Then, navigate to the left hand menu of the webpage, and select “Customized Tables.” This lets you select a range of TRI attributes to add to your exported table. Make sure your data table includes
- the total on and offsite release,
- the latitude & longitude (so you can map it as a point!),
- TRI name, and
- the chemical (in case you’re use that in your analysis somehow).
- Include any other information you’ll find helpful.
- No metadata I could find on that page told me about the datum for the lat/long of the TRI facilities. But the metadata from the full data service said that locations now come from EPA’s Facility Registration Service whose standards are here. Search that document for “datum” to reveal it. Short story for your first project: lat/long data are NAD83. It is important to do this digging, so I’ll leave that up to you in future projects.
- download the csv file to your downloads folder (you are able to download an excel version, but I had troubles with numbers vs text!)
- start here https://data.census.gov/
Notes on data processing
-
-
- Before doing any display, analysis and processing, isolate only those Census Tracts and TRI points that are in the study area (note that clipping tracts might invalidate the area calculations some may choose to complete; you’d perhaps have to recalculate the geometry but certainly you should check edge parcels original and clipped geometry values). The Tidewater “study area” can be found in the project folder R:\courses\EEG_316_GIS_2026\sharedwork\projects\project1_2026

- Table data that has a column of for X and Y (either in measured units like feet or meters, or as decimal degrees) can be uploaded into QGIS as long as you know the CRS. Search the web for “QGIS XY data” for several how to’s.
- TRI data – NOTE! There may be multiple rows for each company/release point (and hence, coordinate pair), so you’ll have to think about how to deal with the overlap. Each row is a different substance released from one facility.
- Best Practice; Save or export features to a project geopackage as you edit them. That way they’re all together in one file for you to use and export as needed..
- Be careful to note the differences in how the GEOID (or GEO_ID, GEOIDFQ) is given. Is it a number or text?
- Think about the map projection for your layout. What should it be?
- Before doing any display, analysis and processing, isolate only those Census Tracts and TRI points that are in the study area (note that clipping tracts might invalidate the area calculations some may choose to complete; you’d perhaps have to recalculate the geometry but certainly you should check edge parcels original and clipped geometry values). The Tidewater “study area” can be found in the project folder R:\courses\EEG_316_GIS_2026\sharedwork\projects\project1_2026
-
The deliverables
- Please post an exported PNG image of your layout to the Canvas Discussion as a large image so we can see it there (you won’t be able to see other posts until you finish posting yours). Canvas accepts “paste” for images. Each person in the team should make a post.
- Below it describe in a few short sentences what you’re trying to show in the layout and what you see in the results (some of what you see :).
- Then post a pdf export of your layout, plus a word doc (or pdf) with the following information to the Canvas assignment
- who completed the project
- where the project folder is located. If you worked together on a laptop, please upload a copy to your folder in P or Q.
- a list of data layers in your folder (by their feature or grid name as stored in the project file and associated geopackages) that contain the information and metadata actually used for the project (not ALL of them, please, just the ones that got you where you wanted to go)
- a snip of the layer panel view of your Layers and their grouping/organization
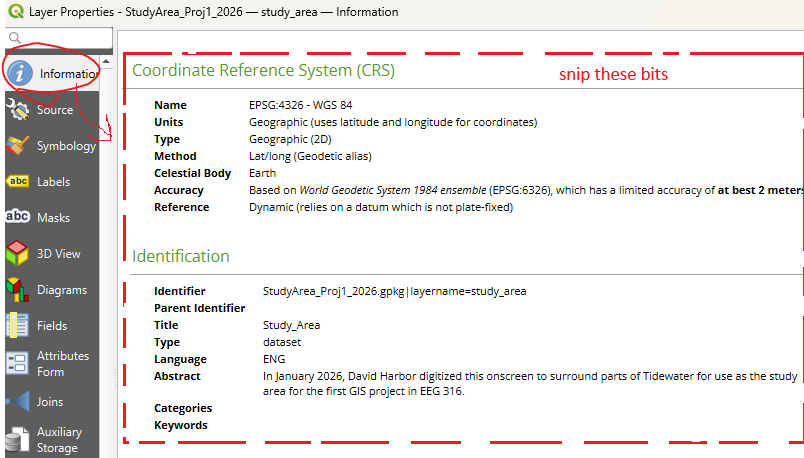
- snips of the map and data metadata you created as seem from the For projects, snip the metadata tab from the project properties. For layers, use the “information” tab at the top and snip just the CRS and “Identification” sections (where you input the information for the metadata). If you do more lengthy or specific metadata, go find it and get credit for being awesome.
- lastly, a very brief bulleted list of the steps taken (here use only a few words, put the detail, if necessary, in the metadata) made from your breadcrumbs.
- I will evaluate your process and results plus the utility and presentation of your final map(s). I may also look at your project folder and assess the organization. Metadata should be present on files that are downloaded and used, plus final layers. Intermediate data layers can be skipped as long as that step is in the final data metadata. It should be clear to me from the “Identifier,” “Title,” and “Abstract” sections of the “Identification” tab what you are up to. You can ignore all the other metadata tabs. You will snip only the CRS and Identification tab as a deliverable.
The rubric (75 points total)
| Pts | Excellent | Good | Fair | Poor | |
| geoprocessing – steps taken and attempt to determine relationship | 5 | 5 – clear path to correct and complex analysis of spatial relationship and it is clearly listed in the report | 4 – got the right data; tried a spatial analyses that show both data layers together (good visualization) | 3 – incorrect or convoluted steps that cloud actual process, and/or not listed completely in step; simple visualization | <3 – untraceable or incomprehensible path of analysis or upload and no analysis beyond display of both raw datasets |
| geoprocessing -getting the right data, and your folder/data architecture | 20 | 20 – All data analyzed to yield correct values for population and toxic releases; relationship explored through further analyses; all data in proper place and well-named | 16-19 – Most data correct, but a processing error yields partially incorrect values; some analysis attempted; data/folder logical but messy or / disordered | 12-15 – processing errors distort the relationship between race/poverty and toxic releases; folders chaotic or disordered; names hard to follow | <12 – presented values have no similarity to actual releases or population; can’t find/access your data files |
| layout presentation general | 10 | 10 –the presentation uses the space wisely and fully, making all elements easy to read and interpret | 8-9 –presentation would benefit from better arrangement, size or kind of layout elements | 6-7 –poorly organized for presentation of data or use of space | <6 – maps, titles and portions of necessary elements dropped into a layout with no thought to utility |
| map elements (legends, north arrow, scale etc) | 10 | 10 – has all the elements and considers extra details that aid understanding; spatial character of map(s) correct. | 8-9 – has most elements requested; map spatial nature is skewed | 6-7 – is missing key elements, which clouds information; spatial presentation incorrect | <6 – lacks necessary items to interpret spatial context and data |
| presentation of map data (symbology, tables and/or labels, etc) | 15 | 15 – results can be easily understood from the map(s) | 12-14 – map(s) are clear but some information is complex or less easy to interpret | 9-11 – data are presented but in a fashion that is difficult for the reader to understand or see | <9 – data are not presented, or are so done in such a way that readers can’t understand |
| metadata | 15 | 15 – all necessary data and maps have clear and brief metadata edited in the project or layer properties box | 12-14 – most or all data and maps have metadata but some is unclear or unnecessarily verbose, or misplaced | 9-11 – insufficient or missing metadata, or it is not recorded correctly | <9 – most data files and map lack metadata |