Patch Simplification and Identifying Separate “Clumps”
The process of querying or classifying grids often leads to isolated small patches of cells and highly irregular boundaries around groups of cells of the same category. The “precision” of their boundaries may outweigh their utility as identifiers of hazard, suitability, or condition. When the map contains “clumps” of different type next to each other in a filled raster, the easiest way to eliminate these two conditions is to use a “median” or “majority” filter (see “filter” in next notes section). This page shows other methods that are helpful when patches are isolated.
Growing and shrinking
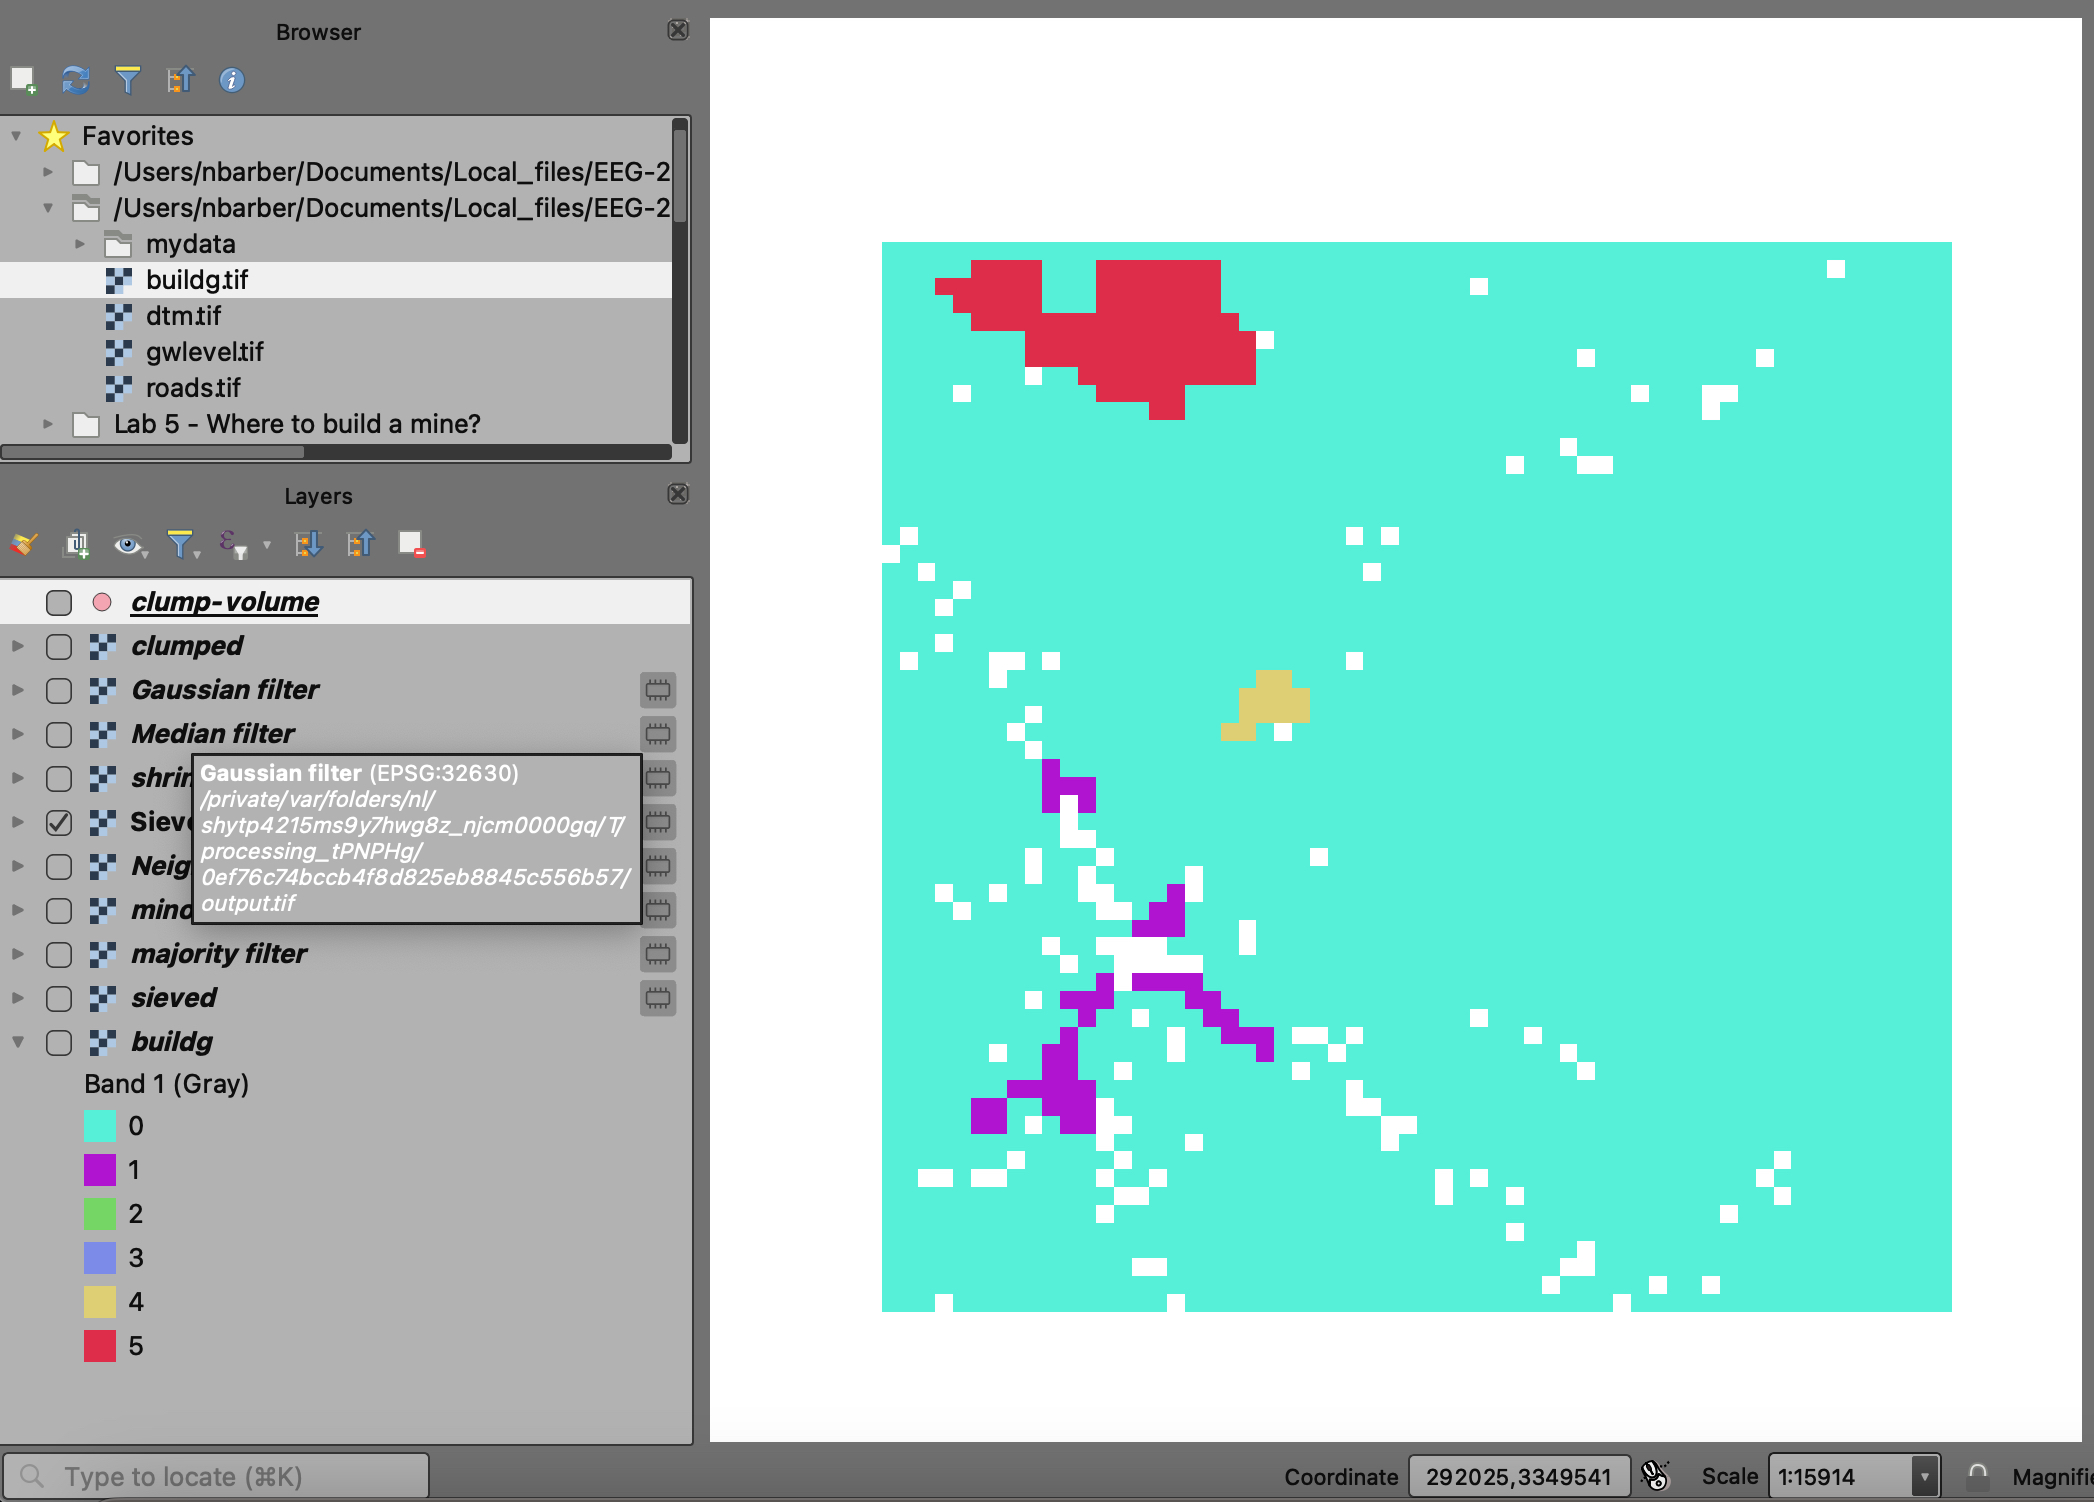
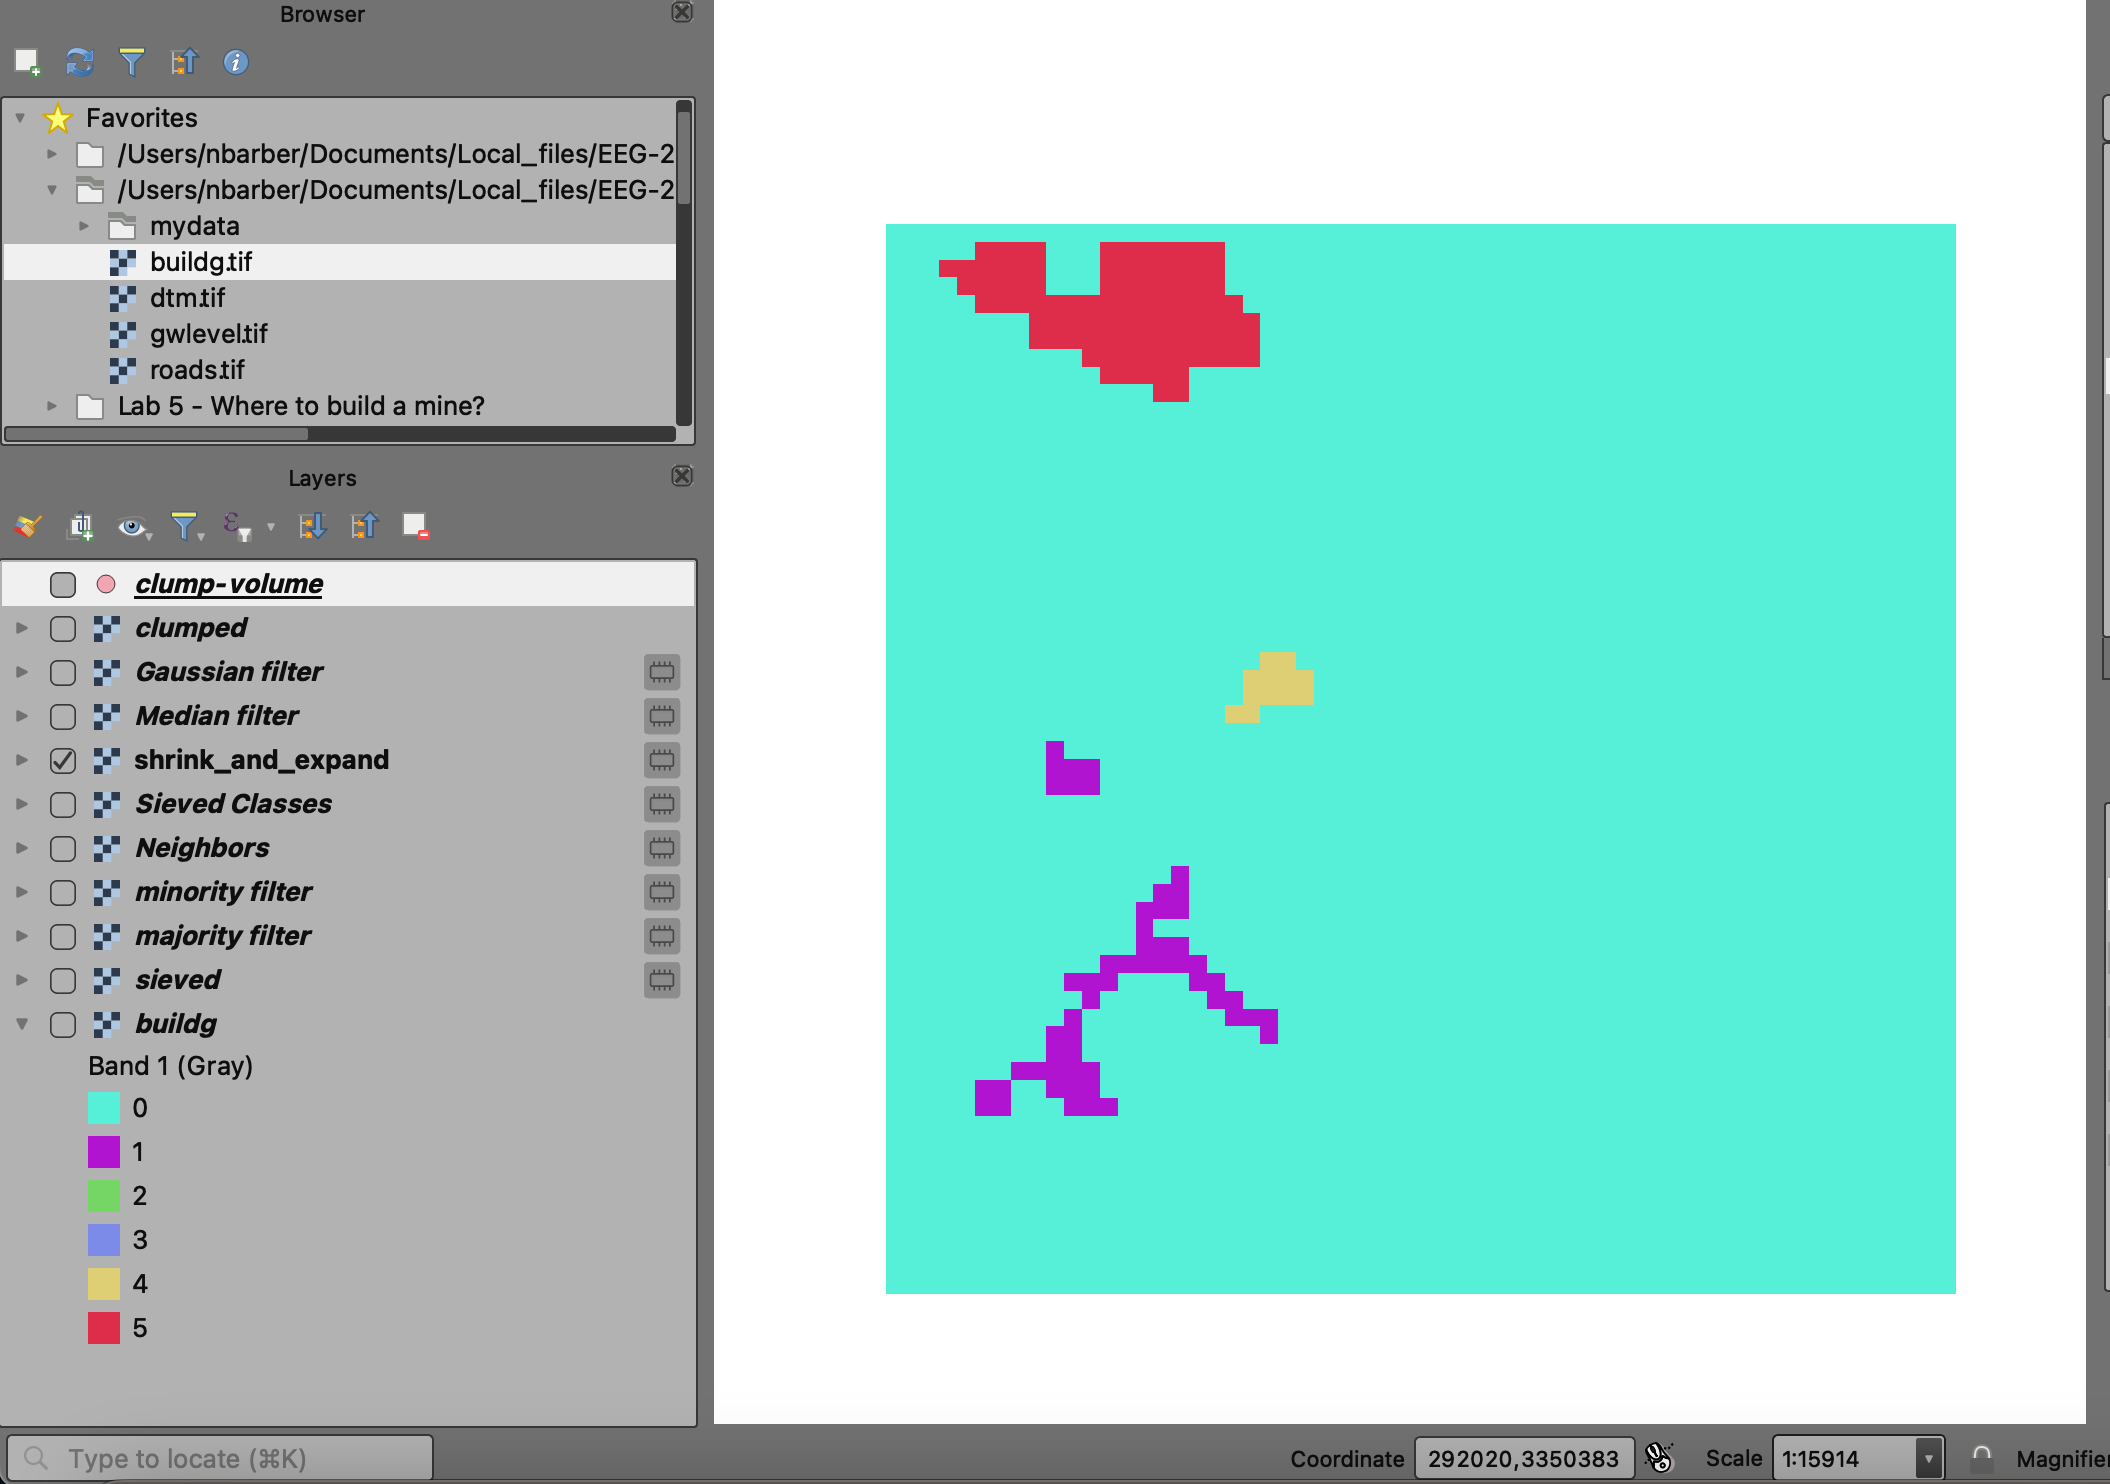
This process simplifies a patch of grid cells or a vector polygon by alternately expanding then shrinking the size of the cell groups or vector polygons (or by shrinking then expanding). For grids, adding one cell around the perimeter of all cell groups and then trimming one has the effect of smooth the boundaries because small embayments are eliminated. In QGIS, this can be done using a combination of two tools: (1) Sieve classes; then (2) Shrink and Expand. The first tool removes outliers; the second tool performs the shrink and expand operation.
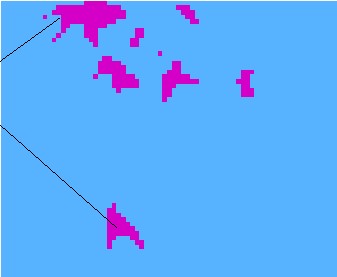
In vector space, growing first and then shrinking by the same distance perpendicular to the boundary looks like this.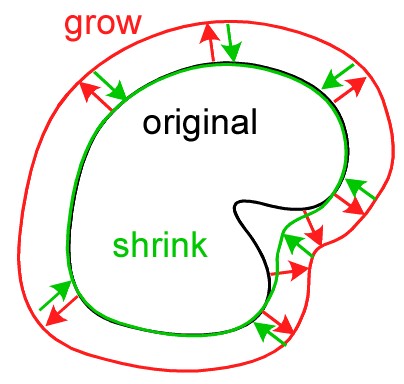
This is grow first then shrink. What would shrink then grow do? Do you want to fill the embayments or erode the peninsulas? QGIS let’s you control this behavior.
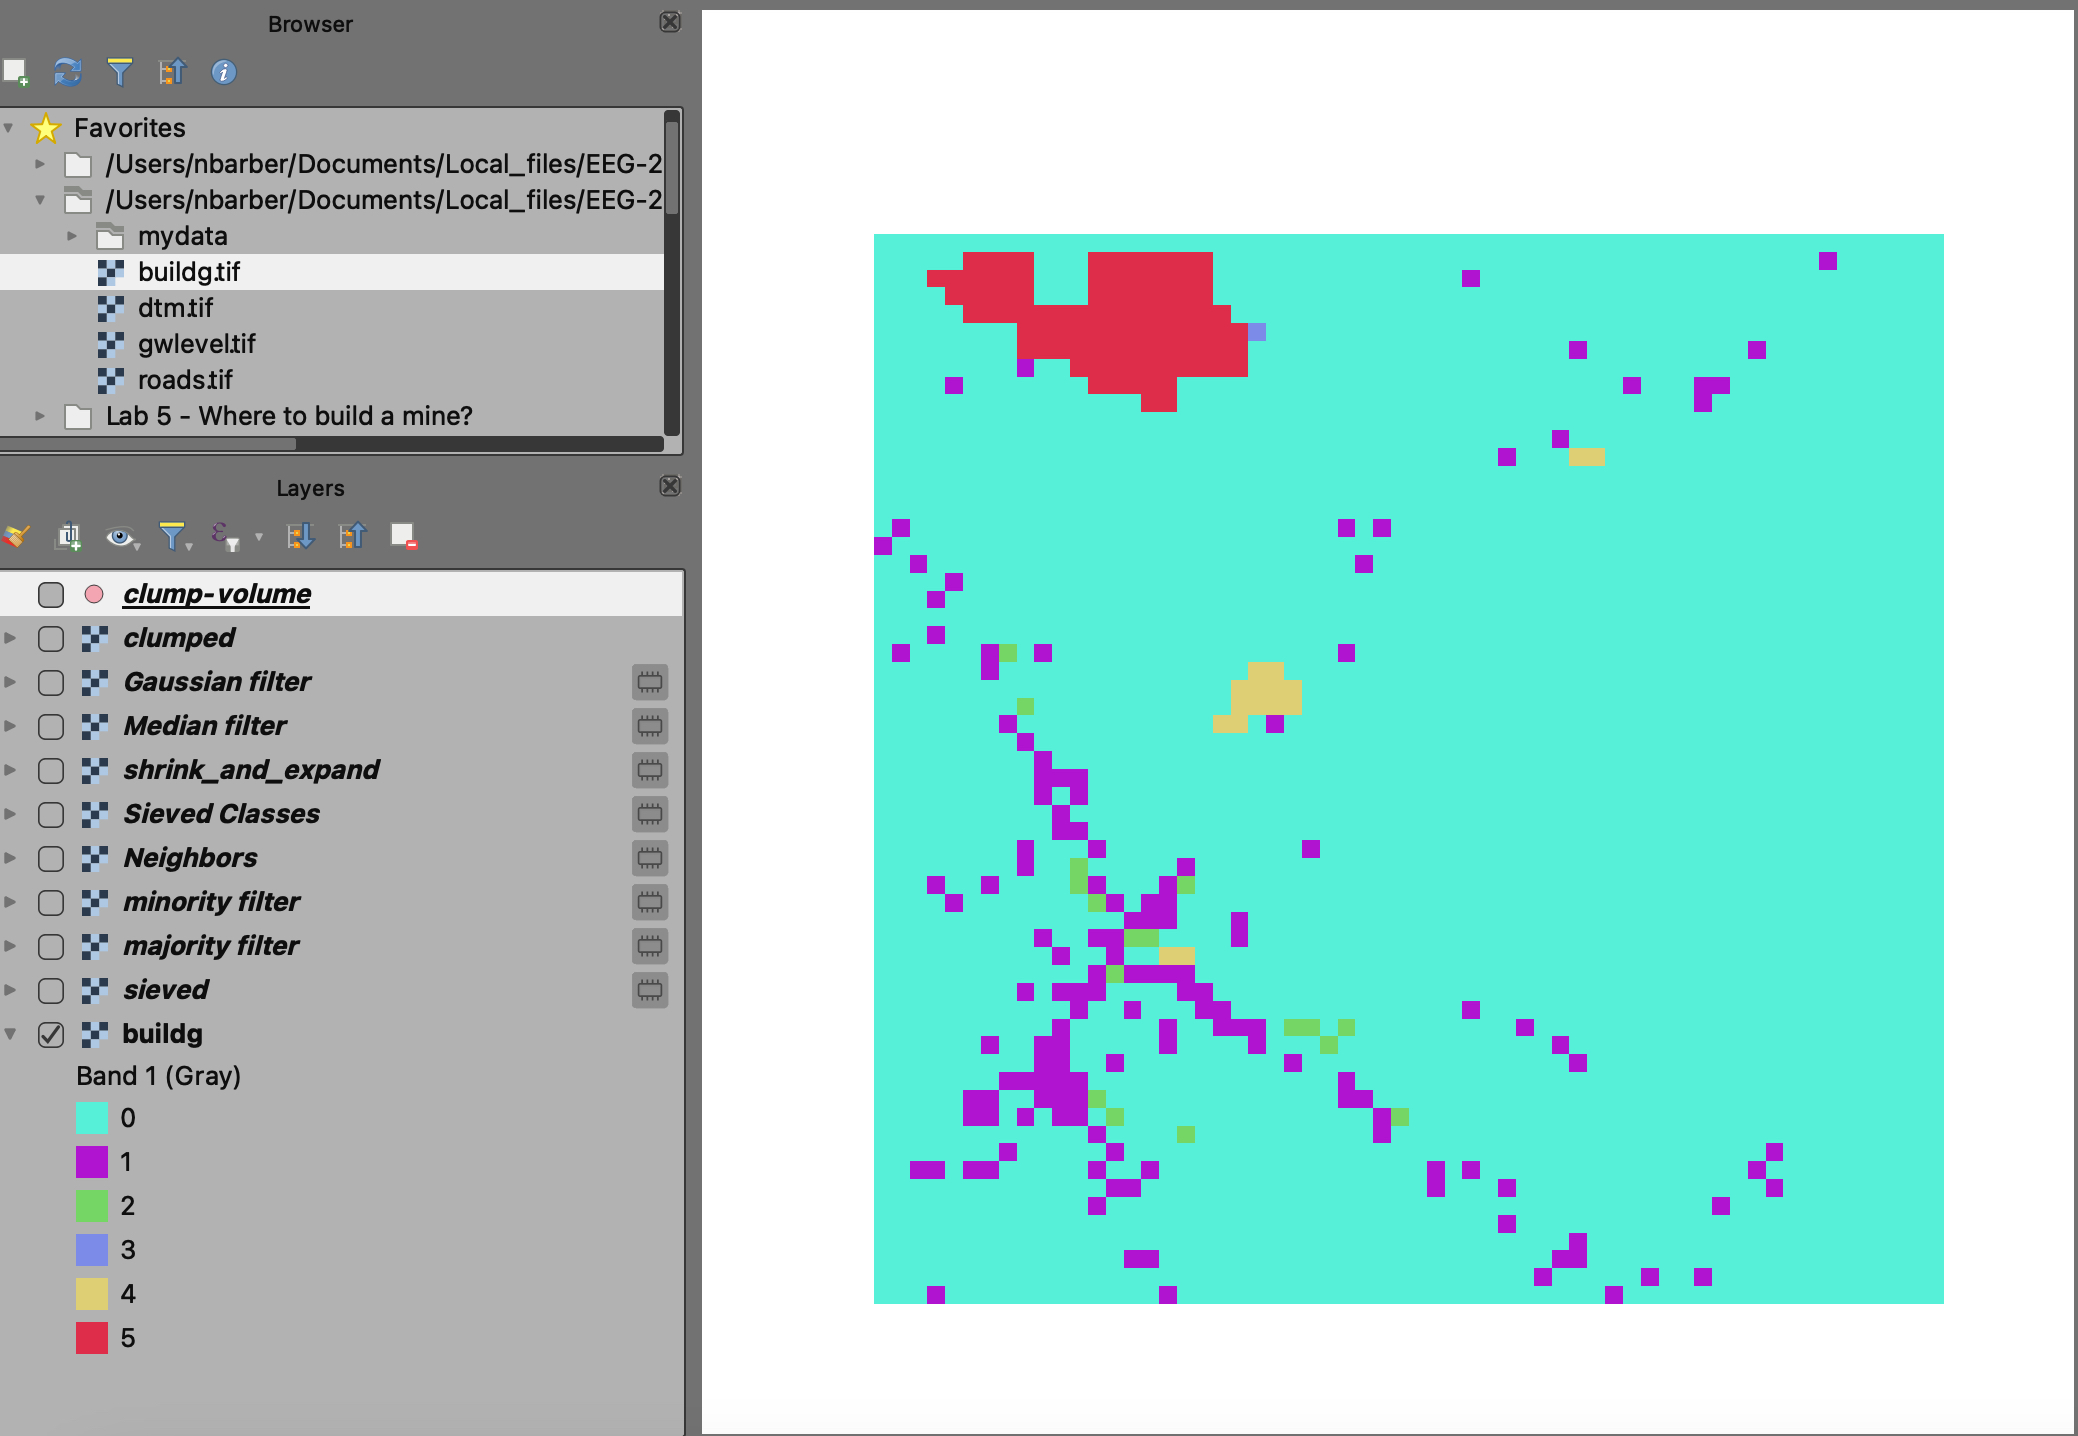
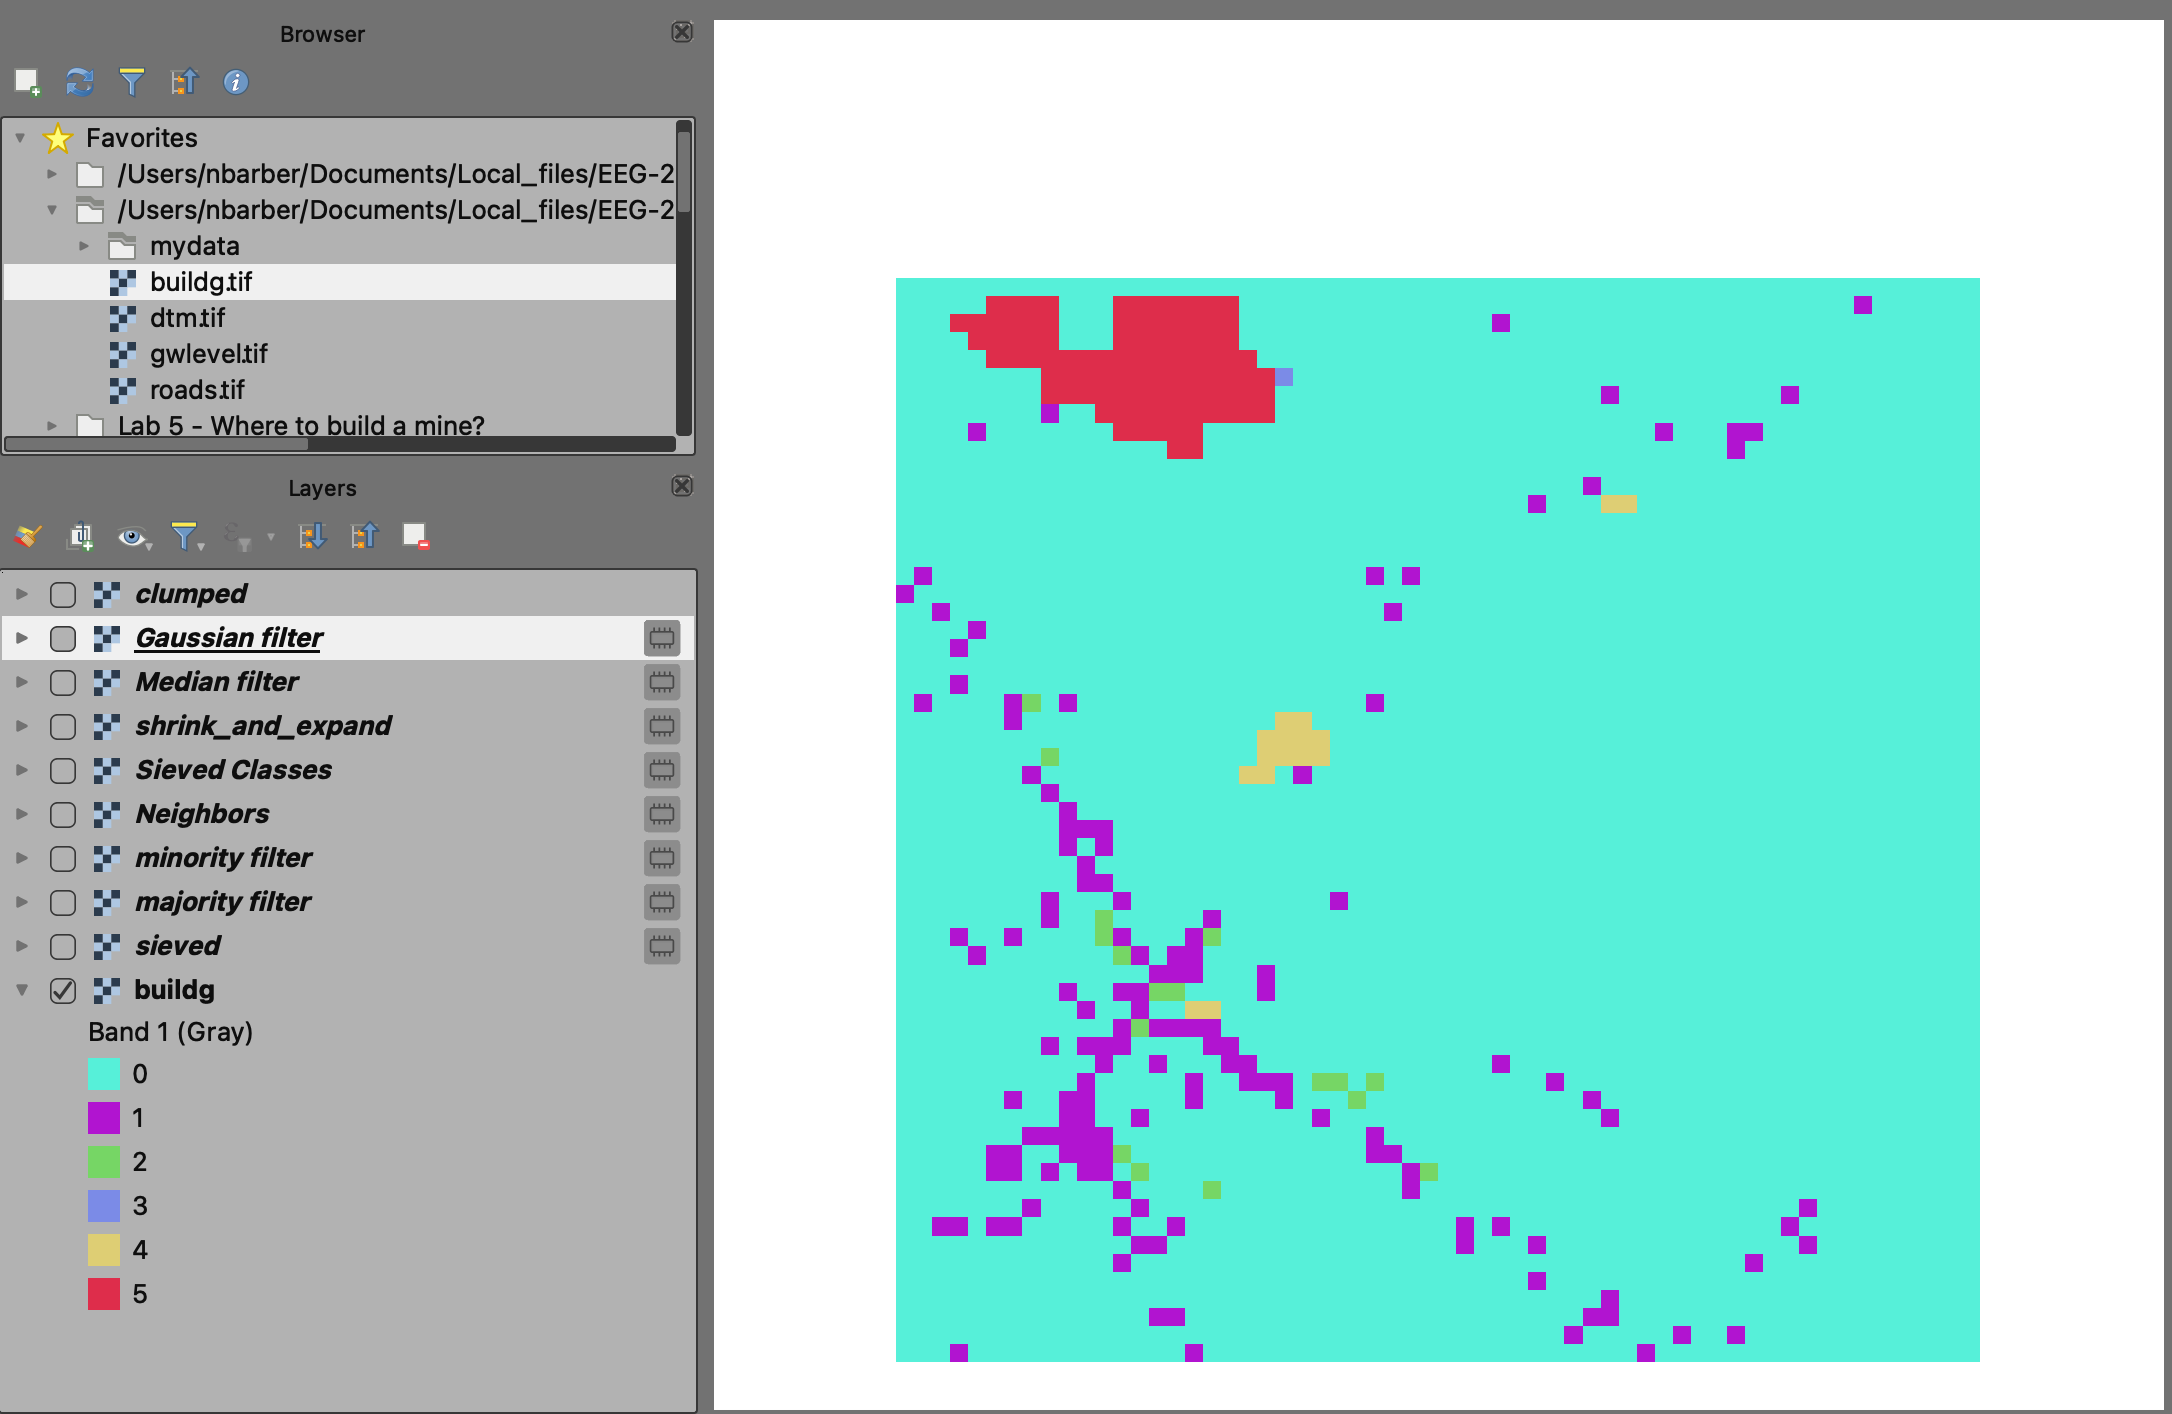
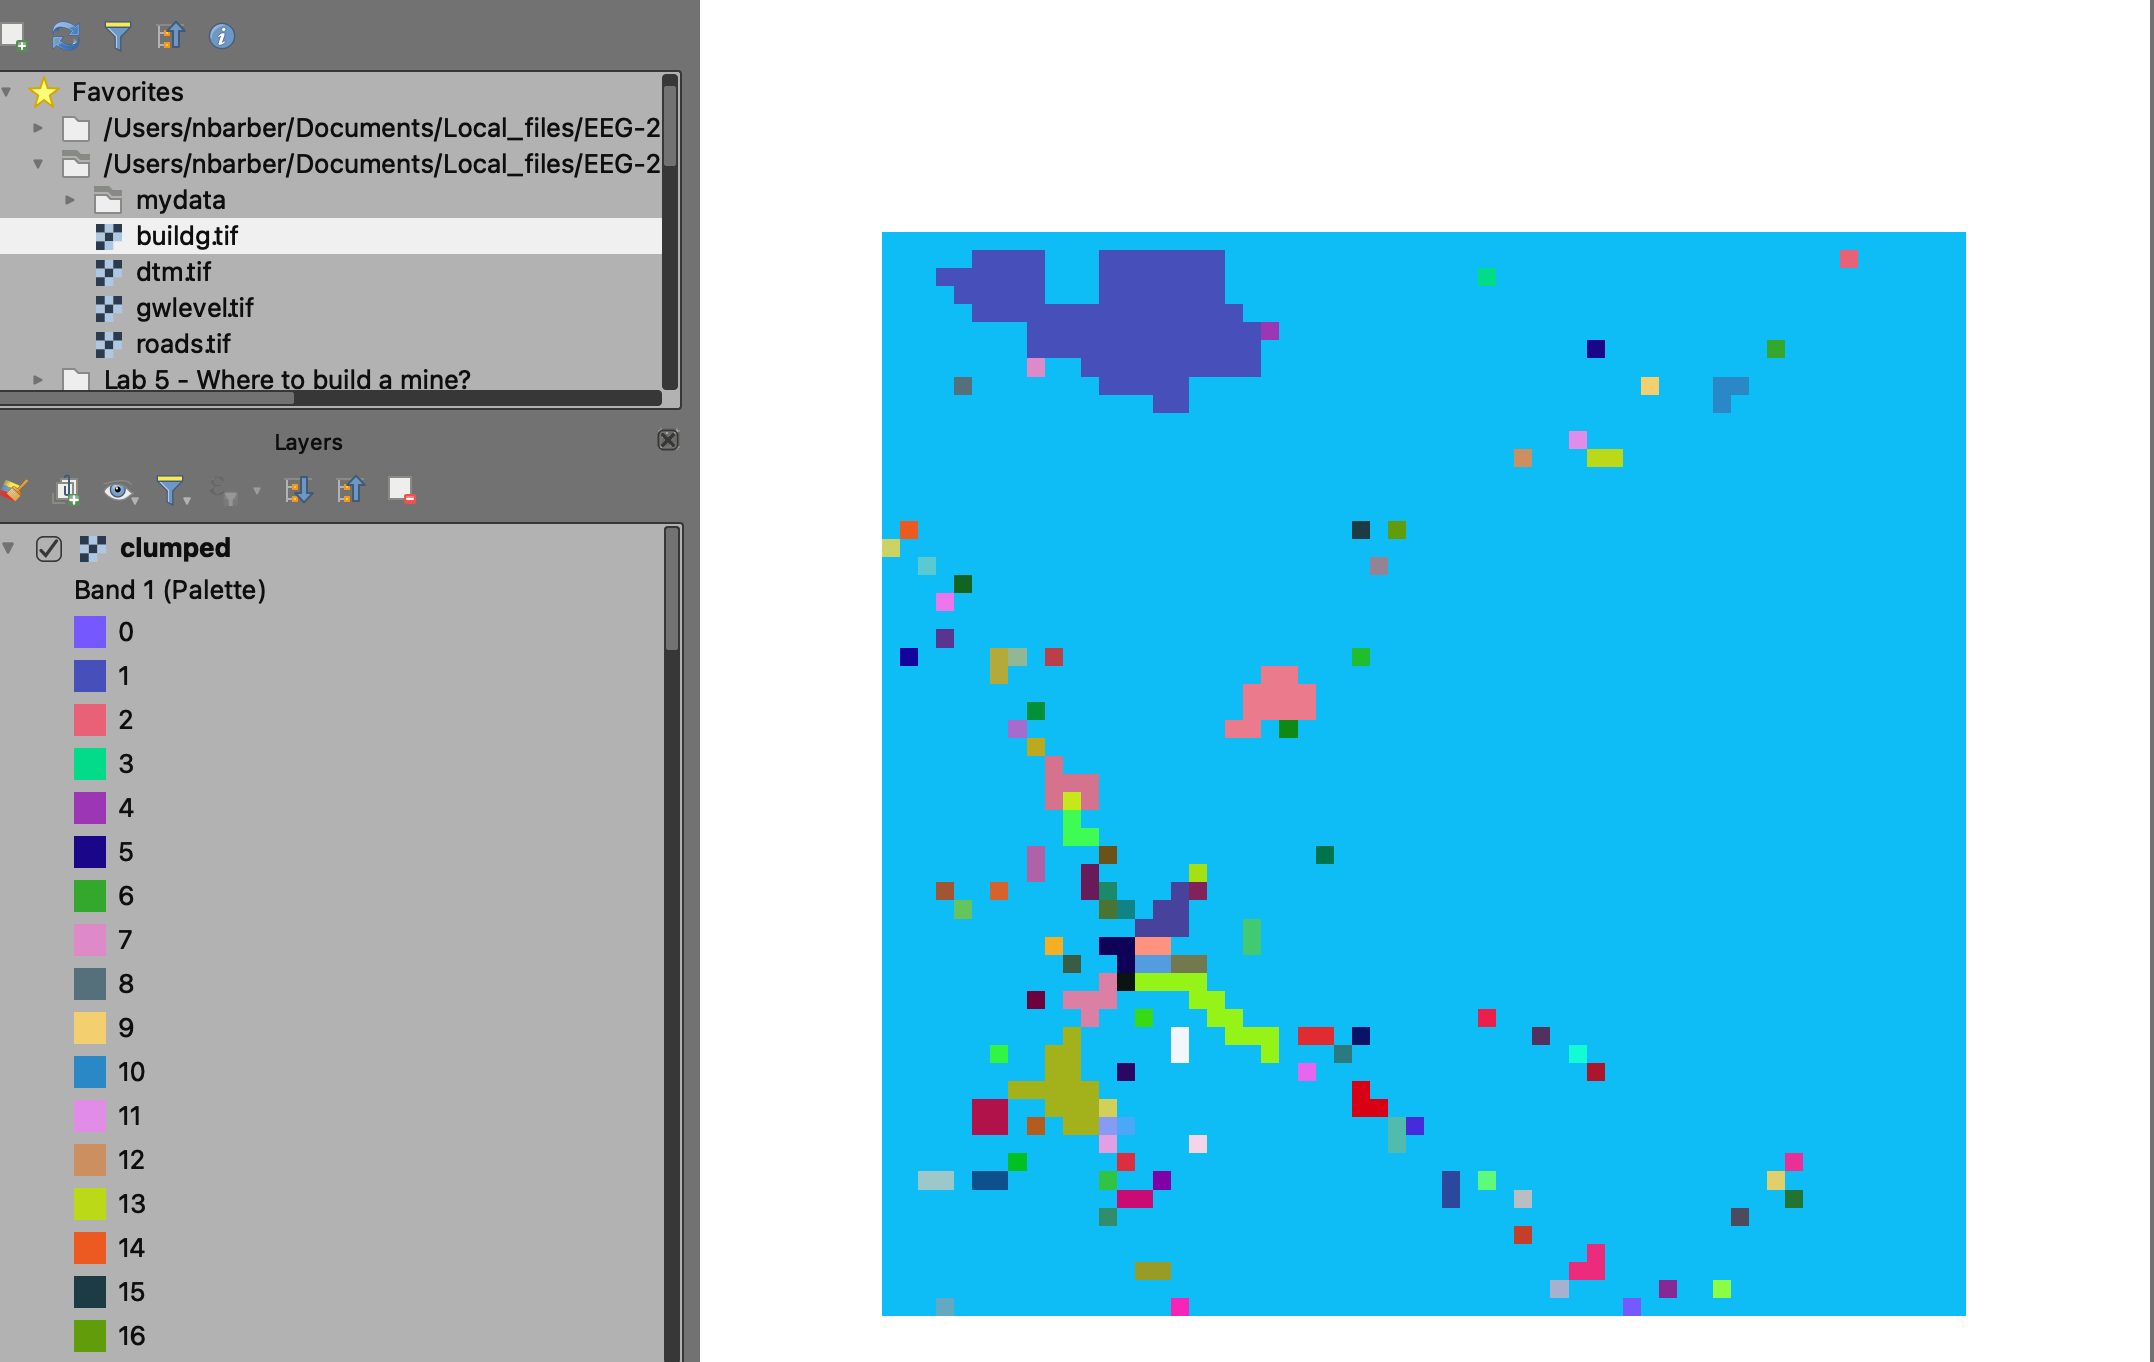
Here’s an example of sieve classes, then shrink & expand applied to an infrastructure raster (classified).
In Raster Space
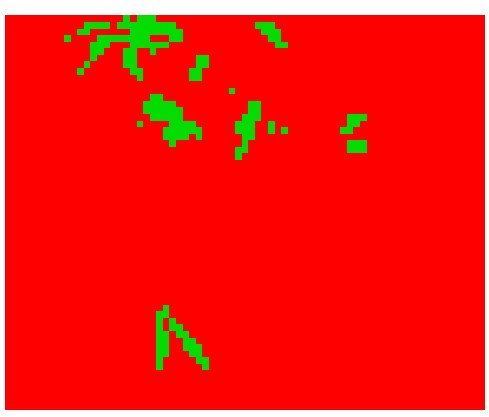
The raster patches or clumps below are available in the “simplify” demo folder. They should really be “patches” because that’s what more of the GIS folks call them, a minority call them “clumps.” These patches were made using the query “elevation > 1200 & slope < 40” from the demo/topo project.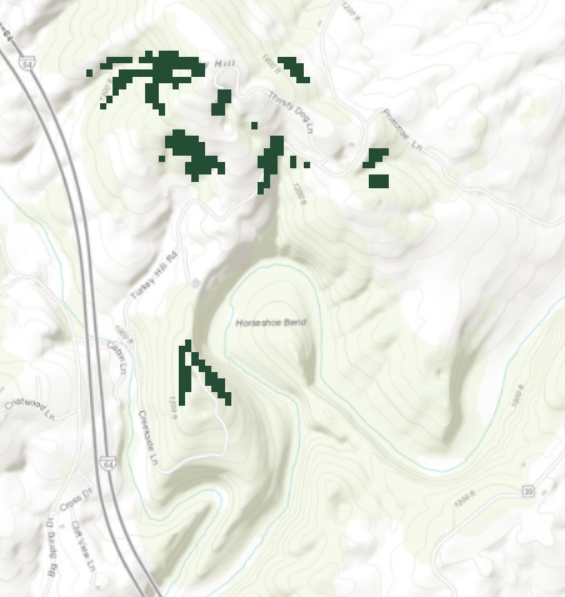
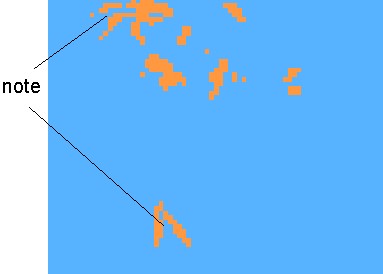
What happens when you “expand” by two cells, then “shrink” vs shrinking first then expanding?
These maps show a grow-shrink done once using the Shrink and Expand tool. Not that there are many ways to sort the patches, by value or by patch size, small to large or large to small. In this case we only have one value, so it wouldn’t matter which sorting routine is used.
If you Configure the Whitebox plugin, you can apply many more advanced filters to data…see next section for details.
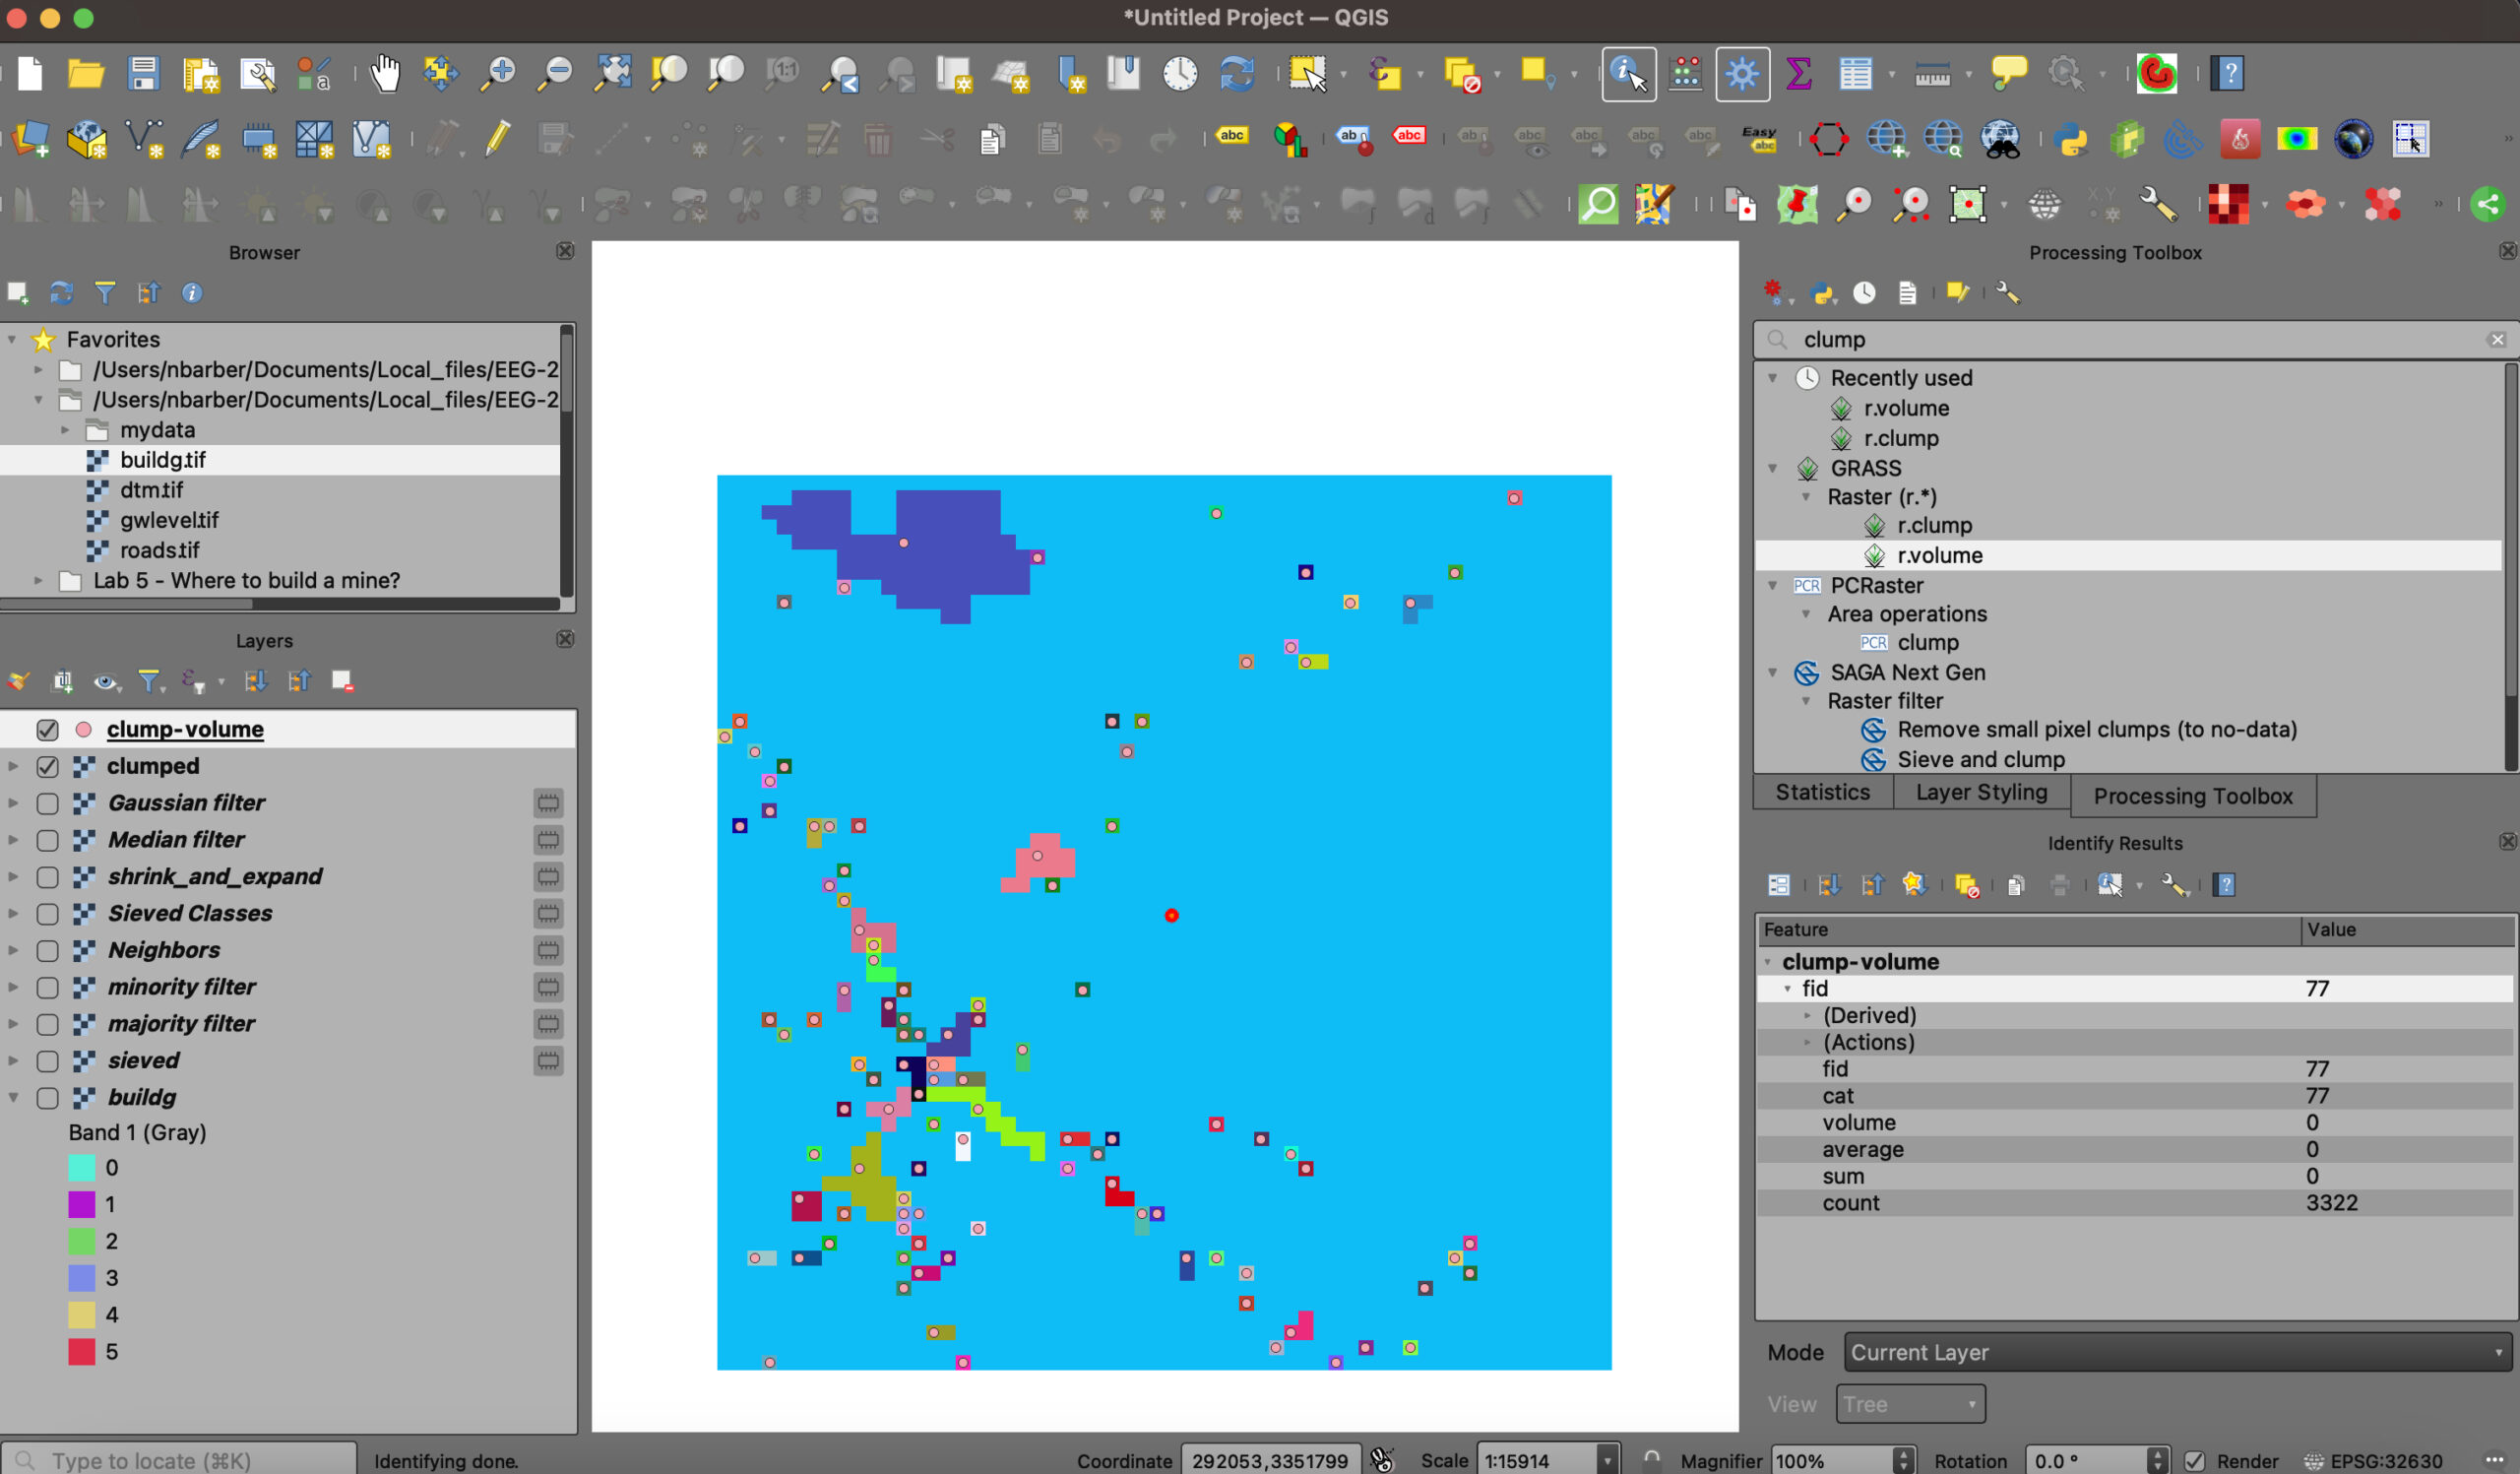
Grouping contiguous cells into individually identified regions
This process allows us to identify contiguous cells as unique patches. This would be important for selecting individual patches in an analyses such as assigning hazard or suitability. In QGIS, this process works on grids where the cells to be “clumped” share a common value, and the rest of the cells have “No Data.” You can see the result of clumping on a building classification raster below. See the r.clump tool help page.
If you want to know how many features of a particular class are present in each clump, you can run the tool r.volume, whose output will be a vector point layer. The attribute table of this point layer will tell you about the statistics of the categories within each clump.