Selecting Data Types (Raster vs Vector)
The number systems of spatial data are of several types and some are suited to raster representation, and some are suited to vector (after Theobald, 2007). Other decisions are necessary for image, terrain or the host of other types
-
- Qualitative or nominal data – discrete (1=basalt, 2=granite, etc for a geological map)
- Ordinal or rank data – discrete (low, medium, high; implies a quantity but is in “bins” or discrete categories)
- interval – continuous (e.g. Temperature)
- ratio – continuous (hillslope angle, which could be measured/calculated to any precision and reported in floating point values or integer values)
- cyclic – continuous (with a break at one or more points, like compass direction for the “aspect” of a hillslope)
The PCRaster plugin defines them slightly differently, and we will use this plugin (link to documentation)
-
- Boolean: cells are 0 (False) or 1 (True).
- Nominal: cells have positive integer values representing classes (discreet raster) without a specific order, for example land-use classes.
- Ordinal: cells have positive integer values representing classes (discreet raster) with a specific order, for example stream order.
- Scalar: cells have real values (decimal, positive, negative). This is used for continuous rasters, for example elevation.
- Directional: for rasters with a compass direction (e.g. aspect).
- LDD: local drain direction, a specific data type for flow direction rasters.
Choosing the format for continuous vs discrete data types
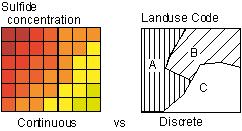
Vector storage better for discrete and raster for continuous

Advantages/Disadvantages
| Vector | Raster |
|
|
Demo in QGIS
- open the intro_Q_grid_v_poly project in the …\demo\intro folder
- The raster layer was created from the vector layer (GDAL command “rasterize”) using a 300 m x 300 m cell size and the objectid for the cell value (raster layers do not have an attribute table on creation, but you can make one if it is ordinal or nominal… or any raster with an integer value for each cell)
- change the transparency of the top layer so you can see them both (layer styling panel or the layer properties box)
Edited by NDB, January 13, 2025 & DJH Jan 8, 2026