Digital Topography – projecting lat-long data
To use it, project a latitude-longitude DEM into distance units
In order to calculate many terrain parameters, most GIS software requires DEMs to be projected from latitude-longitude into distance units like ft or m. Others don’t (Matlab, for one) cause they work in spherical coordinates. When you project a dataset, the input and output cells are different, for location, orientation and size.
Because the cell centers are not overlapping, the choice of resampling method is important for getting a good value for the projected data cells. This is also true for remote sensing imagery.
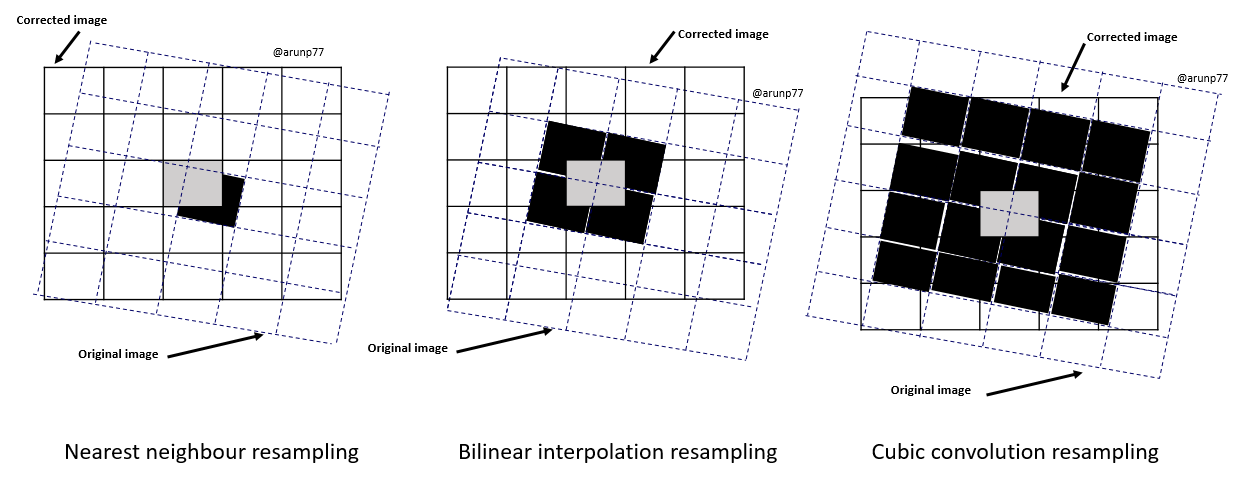
- nearest neighbor selects the closest cell to the correct geographic location (computationally easy, but can result in shifts in linear features and edges, and cyclic jumps in continuous data). It is most suitable for discrete or categorical data. This is the default method in both QGIS and ArcGIS Pro and it is NOT APPROPRIATE for a DEM. You’ve been warned ;>|
- bilinear interpolates the value for the DN in the 4 cells closest to the output cell in x and y (extreme data are lost; image is “smoothed”). Appropriate for continuous data.
- cubic convolution uses an array of 16 surrounding original cells to fit to a polynomial surface to estimate the new grid cell center value. Appropriate for continuous data.
- majority resampling uses the most common value in a 4×4 window surrounding the new cell location. Appropriate for categorical data.
To compare the Nearest Neighbor and Cubic methods, see the resampling groups on the same QGIS project.
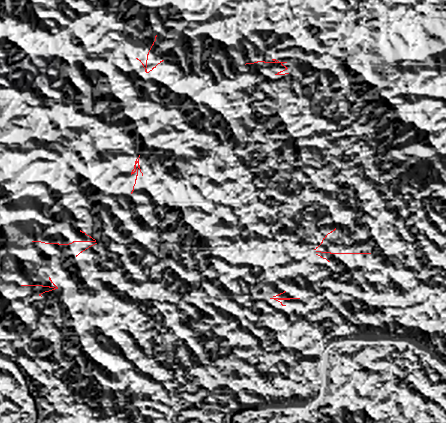
Not even the experts get this one correct all the time. In this great video showing the hydrological analysis of DEM data using PCRaster, the author of PCRaster, Hans van der Kwast , produces a projected DEM using nearest neighbor. His hillshade clearly shows those cyclic resampling artifacts as steps in the DEM.